
The current spot and contract market for ADA shows a moderate one-sided upward trend, with prices above key long-term moving averages, and market sentiment leaning towards optimism. The contract market funding rate is extremely low, and the long-short ratio has declined, indicating that leverage sentiment is not overheated, but prices have reached the upper Bollinger Band, facing technical adjustment pressure in the short term.
Multi-period structural analysis
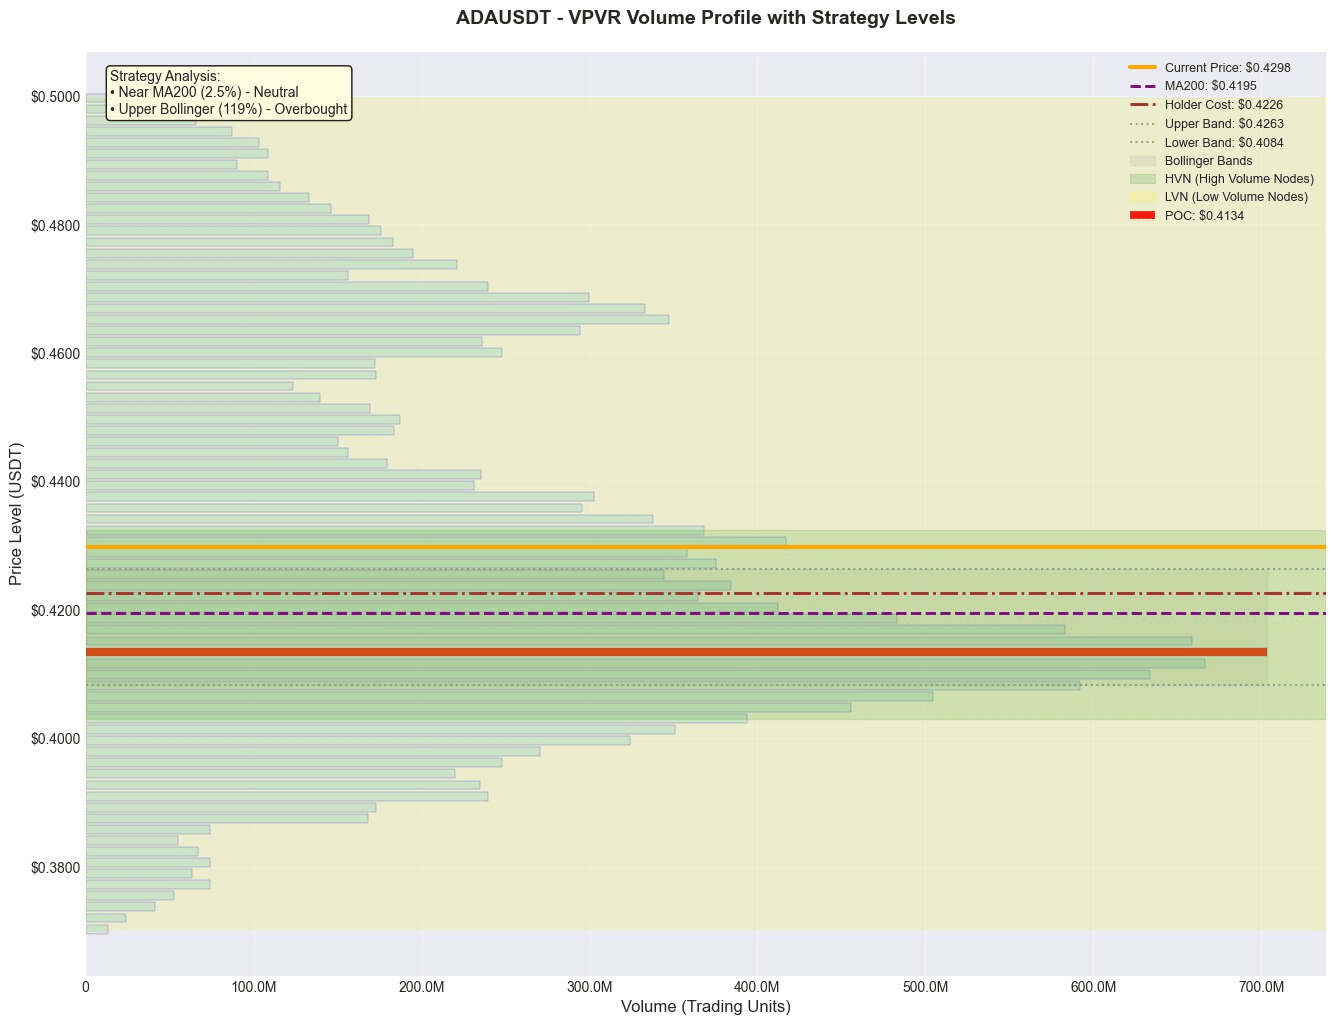
1. Long-term perspective (months-1 year): The current price is 0.4298, approximately 2.5% higher than MA200 (0.4195), and also higher than the market holding cost (0.4226), indicating that the long-term trend structure remains bullish, with prices at the mid-high range of the long-term interval. Combined with prices running above MA200, it is currently in the early stages of a bullish market fluctuation or upward phase.
2. Medium-term Perspective (1-3 months): The recent trend direction is upward, with a 24-hour increase of 2.53%, and trading volume has increased to 2.1 times the average, indicating strong upward momentum. In terms of volatility, the price has reached the upper Bollinger Band, indicating a short-term increase in volatility.
3. Short-term Perspective (Next 7-30 days): The price of 0.4298 is significantly above the upper Bollinger Band (0.4263), with the Bollinger Band position showing 119.3%, indicating a clear short-term overbought state. The key short-term support level is near the middle Bollinger Band and POC (0.4134), with no obvious technical resistance above, but attention should be paid to the long-term psychological resistance formed by major sell orders (0.9, 0.8).
4. High Trading Volume/Concentration Area (HVN): VPVR data shows that POC (maximum traded price) is at 0.4134, which is the most important value anchoring area recently. The Value Area (VA) range is from 0.3910 to 0.4703, with its lower edge (VAL) forming a strong support zone with POC. The price is currently running near the upper edge of VA (VAH), facing pressure to pull back into the VA.
Derivatives and Liquidity Analysis
• Leverage Fund Sentiment: The funding rate is extremely low (0.00000281), and the long-short ratio has fallen from 1.3273 to 1.2198, indicating that although the price has increased, the leverage of long positions in the contract market has not significantly increased and has even cooled down, showing no obvious signs of long crowding.
• Liquidity Signals: Contract trading volume increased by 15.9%, and open interest (OI) is $112.26 million, indicating sufficient market liquidity with no signs of exhaustion.
• Leverage Recommendations: The current derivatives environment is relatively healthy, with no extreme sentiment. However, since the price is in a technically overbought position, it is not suitable to amplify leverage to go long at this point. It is more suitable to wait for the price to pull back and release the overbought pressure before considering entry with lower leverage.
News and Event Impact
Current news summaries are all routine market information and price reporting platforms (such as Nasdaq, NewsNow), with no mention of specific, assessable significant fundamental events. Therefore, the current market is mainly driven by technical and funding aspects, with no significant news sentiment impact.
Trading Strategy
• Direction: Wait and see, or wait for a pullback before looking for low long opportunities.
• Specific Plan (Callback to Go Long):
• Entry Range: 0.4130 - 0.4180 (This range covers POC 0.4134 and the upper Bollinger Band region, serving as strong support and value return area).
• Stop Loss: 0.4050 (below POC and the lower edge of the recent dense trading area, about -2.0% from the midpoint of the entry range).
• Target Price: 0.4450 (extension of the previous high and potential resistance above VAH, about +6.5% from the midpoint of the entry range).
• Profit and Loss Ratio Calculation: Expected Profit Margin Y = 6.5%, Expected Loss Margin X = 2.0%, Profit and Loss Ratio = 6.5% / 2.0% = 3.25:1, meeting the principle of ≥2:1.
• Explanation: The current price for directly going long has a poor profit and loss ratio (stop loss needs to be set below the lower Bollinger Band, with a large space), while directly going short lacks a trend reversal signal and goes against the major trend. The best strategy is to patiently wait for the price to pull back to the above support area and intervene when a stabilization signal appears.
Risk Warning and Position Management
1. Technical Pullback Risk: The price is outside the upper Bollinger Band, severely overbought, and a technical pullback may occur at any time in the short term; the risk of chasing highs is extremely high.
2. Liquidity Structure Risk: Major buy orders are accumulated at positions far below the current price, such as 0.35 and 0.30, while buy orders at near prices show weak support. If the price drops, it may accelerate to deeper support.
3. Position Management Recommendations:
• If executing the above callback to go long strategy, it is recommended to adopt a staggered position building approach, entering the support range in two batches.
• Total position risk should be controlled within 1%-2% of the account principal. Since this is a counter short-term pullback trend operation, high leverage should be avoided; it is recommended that the leverage multiplier does not exceed 3x.
• If the price fails to stabilize at the support level and breaks below the stop loss at 0.4050 with increased volume, strict stop loss should be enforced and a wait-and-see approach should be adopted, waiting for a new structure to form.
Like and follow for real-time updates!
$ADA
