
The current SOL spot and contract market is showing a weak oscillating downward pattern. The price has fallen below the MA200 and the market average holding cost, and is located in the lower half of the Bollinger Bands, indicating a weak short-term technical outlook. Although the 24-hour trading volume has increased, selling pressure is significantly greater than buying pressure, and market sentiment is cautious. A one-sided panic has not yet formed, but further downside risk should be monitored.
Key prices and range structure
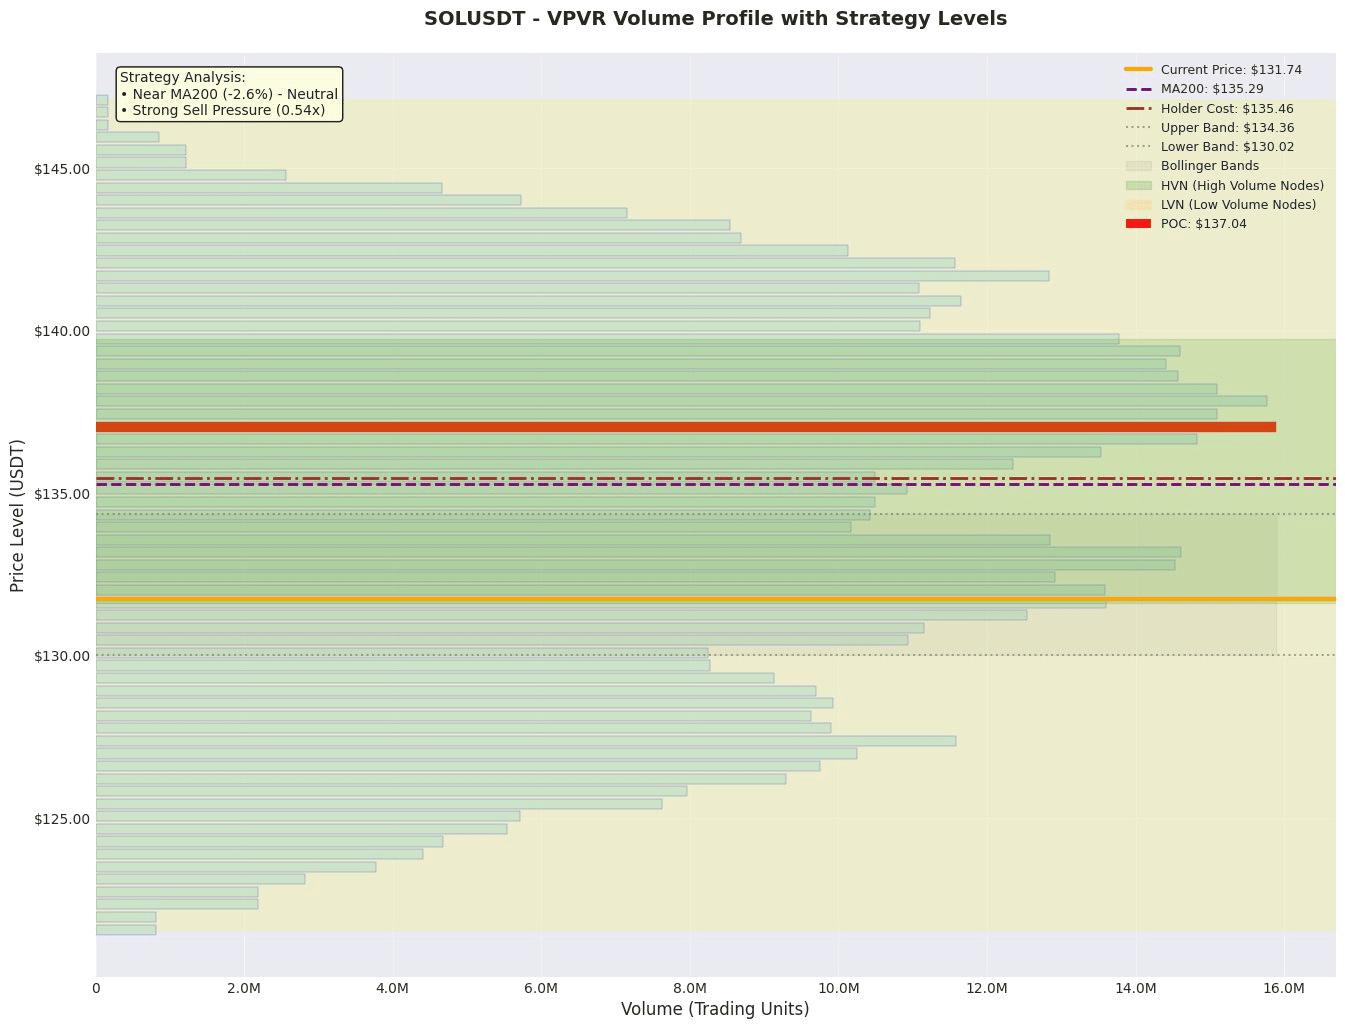
1. Value anchoring area: According to VPVR data, the current value anchor (POC) is at 137.04, which is the core trading area of the market over the past period, forming strong resistance above. The value range is from 127.00 to 142.46, which is the main trading range of the price. The current price of 131.74 is located in the lower half of this range, close to the lower edge of 127.00, which will serve as an important support area.
2. Trend and Volatility Range: MA200 is at 135.29, the current price is about 2.6% below it, indicating that the medium to long-term trend has turned bearish. The upper and lower Bollinger Band limits are 134.36 and 130.02, with the price at the 39.6% percentile, in a weak range. The current price is running below the middle Bollinger Band, and the short-term volatility range is compressed between 130.02 and 134.36, soon facing a directional choice.
3. High Trading Volume/Chip Concentration Area (HVN): The Value Area (127.00-142.46) in VPVR data can be viewed as a wide HVN buffer zone. Additionally, data shows significant sell orders piled up at 135.0 and 147.7 (approximately $3.08 million and $4.37 million respectively), which form clear resistance zones above. Meanwhile, 120.0 and 100.0 are important buying concentration areas below and can be seen as potential support.
Derivatives and Liquidity Analysis
• Leverage Capital Bias: The funding rate is slightly negative (-0.007563%), indicating that the contract market sentiment is slightly bearish, but no extreme bearishness is observed. The long-short ratio has slightly decreased from 2.0714 to 2.0362, with bulls still in the lead but their advantage weakening, and no overcrowding has been observed.
• Liquidity Status: Open interest (OI) is as high as $1.068 billion, and the OI/market cap ratio data is abnormally high (1217741.85%, this data may be erroneous or for display purposes, need to be referenced cautiously), indicating that the market leverage positions are heavy. At the same time, contract trading volume has decreased by 19.3% in the last 24 hours, showing a 'decrease in volume with a price drop' characteristic, which does not indicate liquidity exhaustion, but suggests that active selling pressure may be weakening or that the market is entering a wait-and-see phase.
• Leverage and Position Suggestions: Under the current environment of high OI, shrinking trading volume, and prices near key support, market volatility may be amplified by leverage liquidations. It is not suitable to increase leverage; it is recommended to focus on low leverage or spot positions and remain highly vigilant.
News and Event Impact
• Currently, there are no major news events. Market trends are primarily driven by technical aspects and derivative capital battles.
Trading Strategy
• Plan One (Conservative/Pullback Short Plan):
• Direction: Short
• Entry Range: 133.50 - 134.50 (Bollinger Band upper limit near 134.36, also resistance below MA200 at 135.29)
• Stop Loss: 136.00 (below POC at 137.04, and exceeds Bollinger Band upper limit)
• Target: First target 130.00 (Bollinger Band lower limit), second target 127.00 (Value Area lower edge)
• Expected Risk-Reward Ratio: Based on entry at 134.00, stop loss at 136.00, target at 130.00, potential loss 2.0, potential profit 4.0, risk-reward ratio is 2.0.
• Plan Two (Aggressive/Breakout Short Plan):
• Direction: Short
• Entry Condition: Price breaks down below 130.00 (Bollinger Band lower limit) with significant volume increase and confirmation
• Stop Loss: 132.00 (returns to the original oscillation range)
• Target: 125.00 (based on ATR extension and technical target above the buying area at 120.0)
• Expected Risk-Reward Ratio: Based on entry at 129.50, stop loss at 132.00, target at 125.00, potential loss 2.5, potential profit 4.5, risk-reward ratio is 1.8.
Risk Warning and Position Management
1. High Leverage Risk: The amount of open contracts is huge, and the market has accumulated a large amount of leveraged positions. Once the price experiences a sharp reversal, it may trigger a chain liquidation, exacerbating market volatility.
2. Liquidity Change Risk: The contract trading volume has decreased by 19.3%. If this continues, it may worsen market depth and increase slippage risk.
3. Support Failure Risk: If the price effectively breaks below the Value Area lower edge at 127.00 and the main buying area at 120.00, it may open up greater downward space.
• Position Management Suggestions:
• It is recommended to use a staggered position building strategy to avoid fully loading at once. Total position exposure risk should not exceed 5% of total account funds.
• Strictly avoid using high leverage. Under the current environment, the leverage ratio should not exceed 3 times.
• If there is a further sharp decline in contract trading volume (e.g., exceeding -30%) or if the price rapidly breaks through key support/resistance levels, new positions should be paused, and existing positions should be strictly reviewed, reducing positions when necessary.
Like and follow for real-time updates!
$SOL

