
The current BNB spot and futures market is exhibiting a high-level fluctuation pattern, with prices closely following the upper Bollinger Band, indicating strong short-term momentum but also a risk of overbuying. The trading volume in the futures market has surged, but the funding rate has dropped to zero, with a moderate increase in the long-short ratio, suggesting intense speculation with leveraged funds but no extreme sentiment of unilateral betting has formed, overall being in a stage of continued trend versus potential correction.
Key prices and range structure
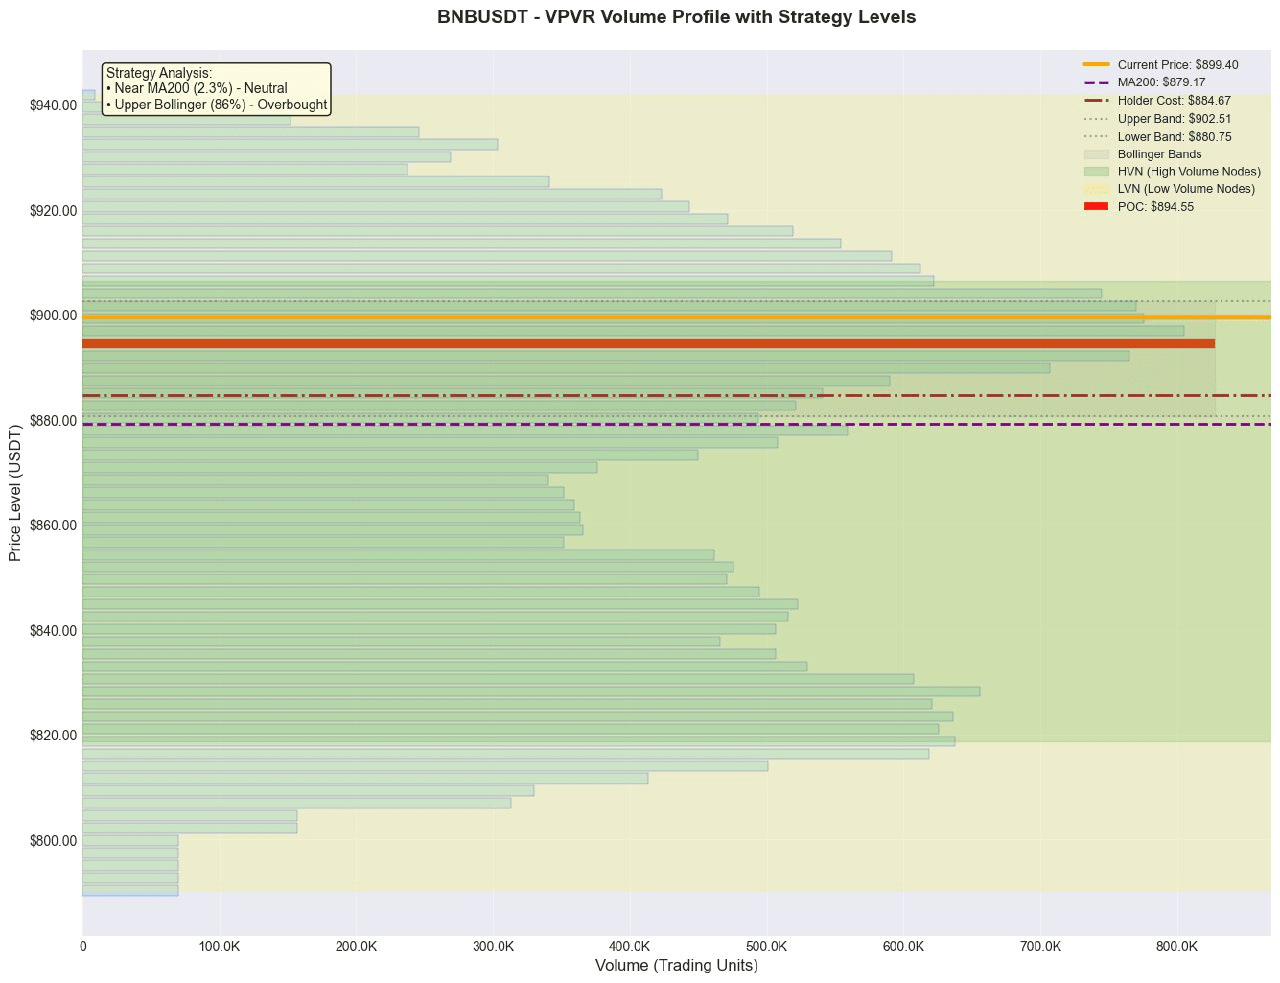
1. Value anchoring zone: According to VPVR data, the value anchoring zone (POC) is at 894.55, with the value area ranging from 814.02 to 918.24. The current price (899.4) is in the upper half of the value area and closely above the POC, indicating that the market temporarily recognizes this area as a fair price center. The POC (894.55) serves as a key support level recently, while the upper boundary of the value area (918.24) coincides with the main selling unit (930.0), creating a strong resistance zone above.
2. Trend and Volatility Range: The price (899.4) is about 2.3% higher than MA200 (879.17), and about 1.7% higher than the holding cost (884.67), confirming a medium to long-term bullish trend. The upper Bollinger Band is at 902.51, and the current price is at the 85.7% percentile of the Bollinger Band, close to the upper band, with short-term volatility expanding and facing pullback pressure. The middle and lower Bollinger Bands (not provided) along with MA200 and holding cost form a dense support zone in the 880-885 area.
3. High Trading Volume/Concentration Zone (HVN): POC (894.55) is the core HVN and is the gravitational point for the price's short-term pullback. Additionally, the main buying units at 860.0 (1653K) and 840.0 (391K) form a distant support zone below; the main selling units at 930.0 (966K) and 955.5 (957K) constitute the resistance zone above.
Derivatives and Liquidity Analysis
• Leverage Capital Inclination: The long-short ratio increased from 1.0488 to 1.0847, showing a slight increase in bullish positions but not reaching extreme levels. The funding rate is 0, indicating a temporary balance between longs and shorts in the perpetual contract market, with no obvious one-sided leverage crowding.
• Liquidity Signals: Contract trading volume surged by 833.9%, but open interest (OI) remained stable at $466 million, with an OI/market value ratio of only 0.38%. This indicates that the massive trading volume was mainly driven by short-term turnover or newly opened hedging positions, rather than trend-based position increases or panic liquidations, with no signs of liquidity exhaustion.
• Leverage and Position Recommendations: In the current environment of high volatility and turnover but balanced long and short positions, it is not suitable to use high leverage. It is recommended to mainly use low leverage or spot positions, avoiding chasing highs when the price approaches the upper Bollinger Band.
News and Event Impact
The current news summary provided is only the title of the platform's information aggregation page, with no specific event content, making it impossible to determine a clear bullish or bearish sentiment. Therefore, there are currently no major news events directly affecting short-term price movements, and the market is mainly driven by technical and capital factors.
Trading Strategy
• Direction: Wait-and-see. Although the medium to long-term trend is upward, the price has reached the upper Bollinger Band (902.51) and selling pressure is significant (buy/sell pressure ratio 0.71x). The short-term risk of chasing highs outweighs the potential gains. It is recommended to wait for the price to pull back to key support areas before looking for long opportunities, or to follow after a strong breakout above key resistance.
• Specific Plan (Potential Long Plan):
• Entry Range: Wait for the price to pull back to the value anchoring area (POC) near 894.55, or the support area of the middle Bollinger Band/MA200 (880-885 area).
• Stop-loss Level: Set below the low of the entry candlestick, or outside the key support area (e.g., 860.0 HVN), specifically around 870.0.
• Target Level: The first target is near the upper edge of the recent high resistance area at 918.24 (VAH), and the second target is at the major sell level above 930.0.
• Expected Risk-Reward Ratio: Based on an entry at 895, stop-loss at 870, and target at 920, the potential profit is 25 points, potential loss is 25 points, giving a risk-reward ratio of 1:1. If the entry point is better (e.g., 885), the risk-reward ratio could improve.
Risk Warning and Position Management
1. Short-term Overbought Risk: The price is at 85.7% high of the Bollinger Band, and there is nearby selling pressure (-782,105 USDT) greater than buying orders, indicating a risk of a technical pullback.
2. High Contract Turnover Risk: Contract trading volume surged by 833.9% but OI did not increase significantly, indicating a large market divergence and unstable positions, making the price prone to rapid reversals.
3. Strong Resistance Risk Above: There are a large number of sell orders at 930.0 and 955.5, making direct breakthroughs difficult, which may suppress the upward space.
• Position and Risk Control Recommendations:
• Currently not suitable for entry, should primarily adopt a wait-and-see approach.
• If executing the above pullback long plan, a staggered entry strategy should be adopted, with the first entry position not exceeding 50% of the planned total position.
• It is recommended that total position risk exposure does not exceed 2% of the account capital, and strict stop-loss should be used. Avoid any form of chasing highs and high leverage operations until the price can effectively stabilize above POC or MA200 support.
Like and follow for real-time updates!
$BNB
