#美联储重启降息步伐 Consultant discusses hot topics:
This week's market is all about one thing: everyone is waiting for the Federal Reserve's announcement at 3 AM on the 11th. First of all, a rate cut is basically a done deal, there's no suspense about that. The key question is whether they dare to lower the expectations for rate cuts next year a bit more dovishly.
If they continue to act hawkish, then get ready for a wave of collective selling. If they dare to soften their tone a bit in line with Trump's wishes, there might be a breather. Because I don't believe at all in the forward guidance coming from these people.
Looking back at last year's end, you can see that the market sentiment was already good around Christmas. Trump won the election, and the rate cut was implemented. But then, old Powell gave a speech that pushed the expectations for rate cuts this year down to two times.
The market has been directly pressed to the ground, and what’s the result? This year it has been cut four times, what does this indicate? It indicates that the plans of these old wall street guys are all just to fool retail investors. When something really happens, they are more cowardly than anyone else.
Now it's the same, whatever the dot plot is, just treat it as nonsense. If they say they want to protect inflation, they are preparing to crush the American economy to death, and it’s highly likely to lead to recession. If they want to protect the economy, they can only cut interest rates faster and harder, with inflation just a smokescreen.
No matter how tough the talk is, the body is very honest. After the new chairman of the Federal Reserve takes office, it will only be closer to Trump's rhythm. The real interest rate cut channel will eventually come, but this December meeting is destined to be torturous.
Back to the market, the structure of the big pie here is already very clear. The large range is from 74.5K to 124.5K, with the midpoint at 99.5K. This place is the most realistic average cost area for the main force this year, and it belongs to a position that is easily pushed back once touched.
Previously, it plundered the high point of 124.5K and then crashed down to test the weekly OB at the lower end of the range. This wave is just a standard rebound, not a restart of a bull market.
First look at the test near 99.5K; if that position is rejected, continue to push down to test the lower support. If it can forcibly stand up and grind sideways, then it has the qualification to talk about continuing upward.
The weekly structure from 15K to 126K has completely finished this segment of the market, and now it is a standard downward cycle. The first segment of the decline from 126.2K to 80.6K has ended, and the high point of this rebound is likely to be crushed near 99K or 107K.
The support from 74.6K to 86K is solid support, but that doesn't mean touching it will always bounce back. It has already been tested back and forth three times, and it will continue to be tossed around.
On the daily line, 80.6K is just a temporary bottom, not a medium- to long-term bottom. If you go to scoop up the so-called big bottom now, you are basically helping the main force to take over. After the rebound ends, the big pie in the 70K range is only a matter of time. Short-term resistance is 94K and 99K, support is 86K and 83.4K.
The wave that pushed up after 1 AM last night was a benefit given by the main force, directly advancing to a resistance level. Moreover, it has already started to lean towards buying call options before the meeting, indicating that they are also engaging in speculation.
After breaking through 91.3K, short sellers can only wait in the range of 93.8K to 94.5K. As long as 94.6K does not break, the shorts around here are basically at the top level. Once 94.6K is pierced, then wait for the fluctuation area of 96.3 to 97.8K to continue to act.
97.2K is the 0.618 position of the previous drop, in other words, it is the limit rebound height, not so easy to stabilize. The high point of this week will likely be the turning point of next week's rise and fall.
Ethereum directly pushed up to 3150 early this morning, and the small level has already given a stop gain signal. The rise from 2903 to 3150 last night at 10 o'clock, with a 247 point rise, has already reached the daily limit, and trying to stabilize at this point is purely a dream.
Here is the standard short opportunity, first look at the pullback in the range of 3062 to 3028. If it stabilizes, then go for a second touch of the pressure at 3222 to 3236, and later 3280, 3336, 3372 will all be short positions.
Master sees the trend:
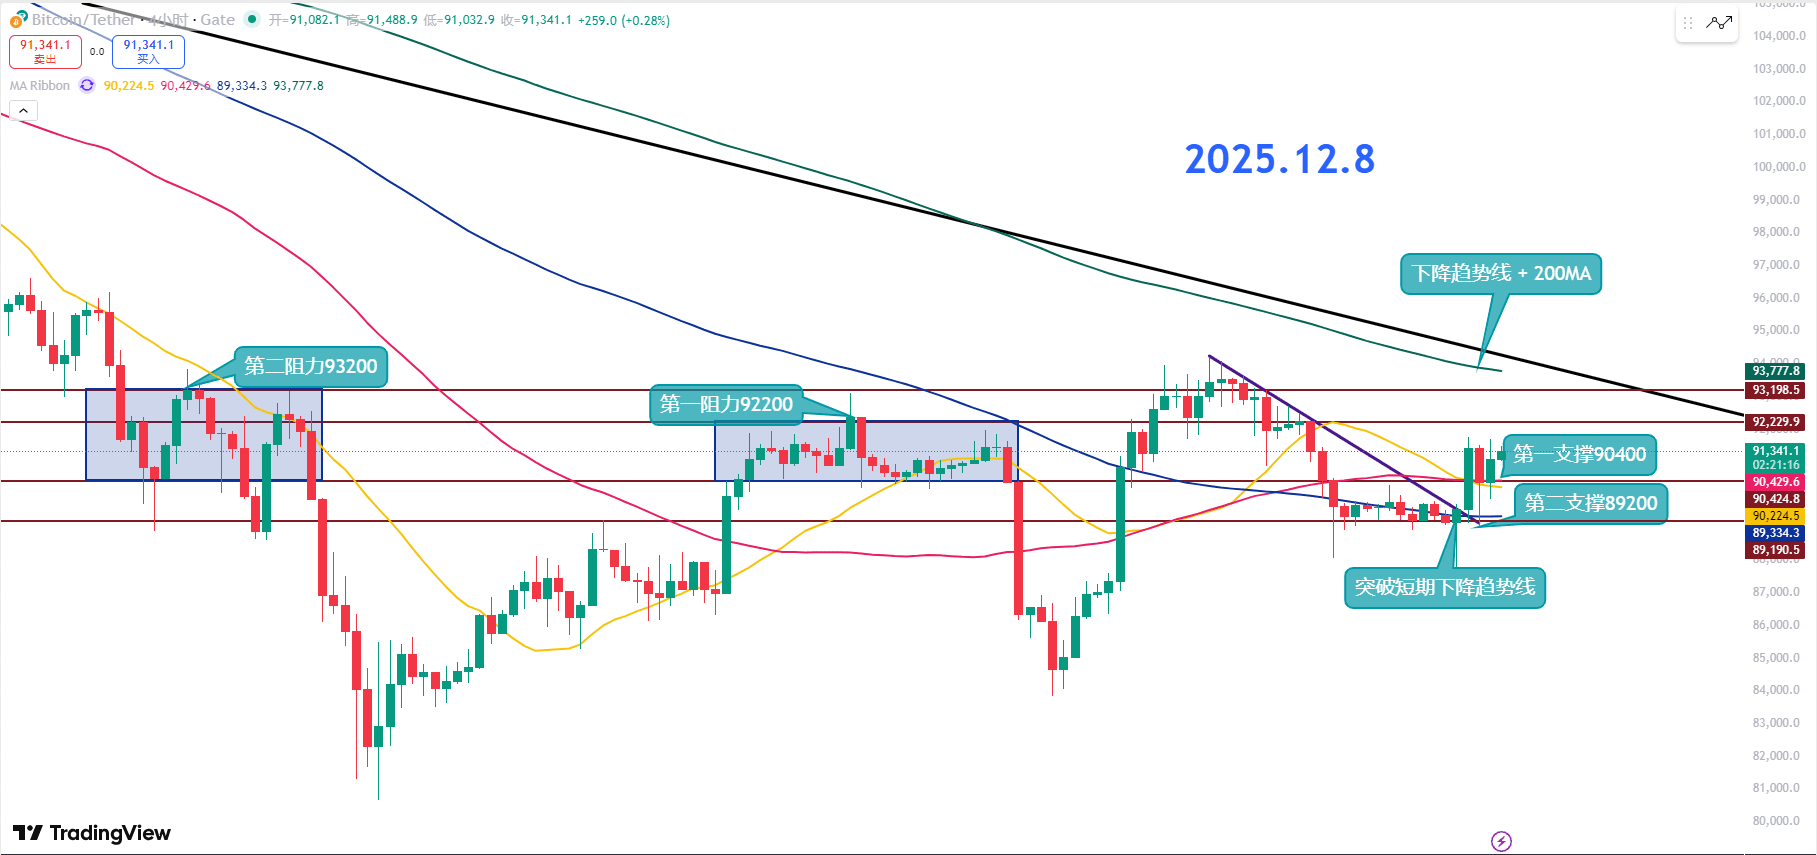
Resistance level reference
Second resistance level: 93200
First resistance level: 92200
Support level reference:
First support level: 90400
Second support level: 89200
Bitcoin has currently forcefully broken through 90.4K, and the resistance level has turned into a support level. Under the structure of not breaking 90K on pullback, there is a possibility of a short-term rebound. The first resistance above is re-locked at 92.2K, while overlapping with the upper Bollinger band, this is not something that can be breached in one go.
The long-term downward trend line at the top and the 200MA are the real bull checkpoints. Before an effective breakthrough, high-level fluctuations and washouts to absorb positions are still the main theme, specifically targeting those chasing high positions.
The focus below should be on the direction of the 20-day and 120-day moving averages, which is the wind direction of the medium-term trend. The RSI value is around 57, still in a position of neither up nor down. Although there is room for further rise, a pullback could happen at any time.
Aggressive players on the short line can enter in batches near the first support at 90.4K, as long as it holds, it will be a standard rebound structure. However, if 90.4K breaks, there is still a risk of continued decline, so I prefer the cost area to be near 89.2K.
But as long as the first support at 90.4K stabilizes, the momentum to impact the first resistance at 92.2K will be even greater after another pullback. However, before breaking the long-term downward trend line and the 200MA, the market is likely still in a slow rise and sharp drop rhythm.
12.8 master wave segment pre-embedded:
Long entry reference: 89200-90000 range long Target: 91500-92200
Short entry reference: 93200-94000 range light position short Target: 92200

