

📊 Professional Market Analysis — Structure, Zones & Probable Playbook
Below is a clean, structured, professional breakdown of the chart you provided, using emojis for clarity while keeping the analysis high-level and trader-friendly.
🔍 📌 MARKET STRUCTURE ANALYSIS
🟡 Overall Context
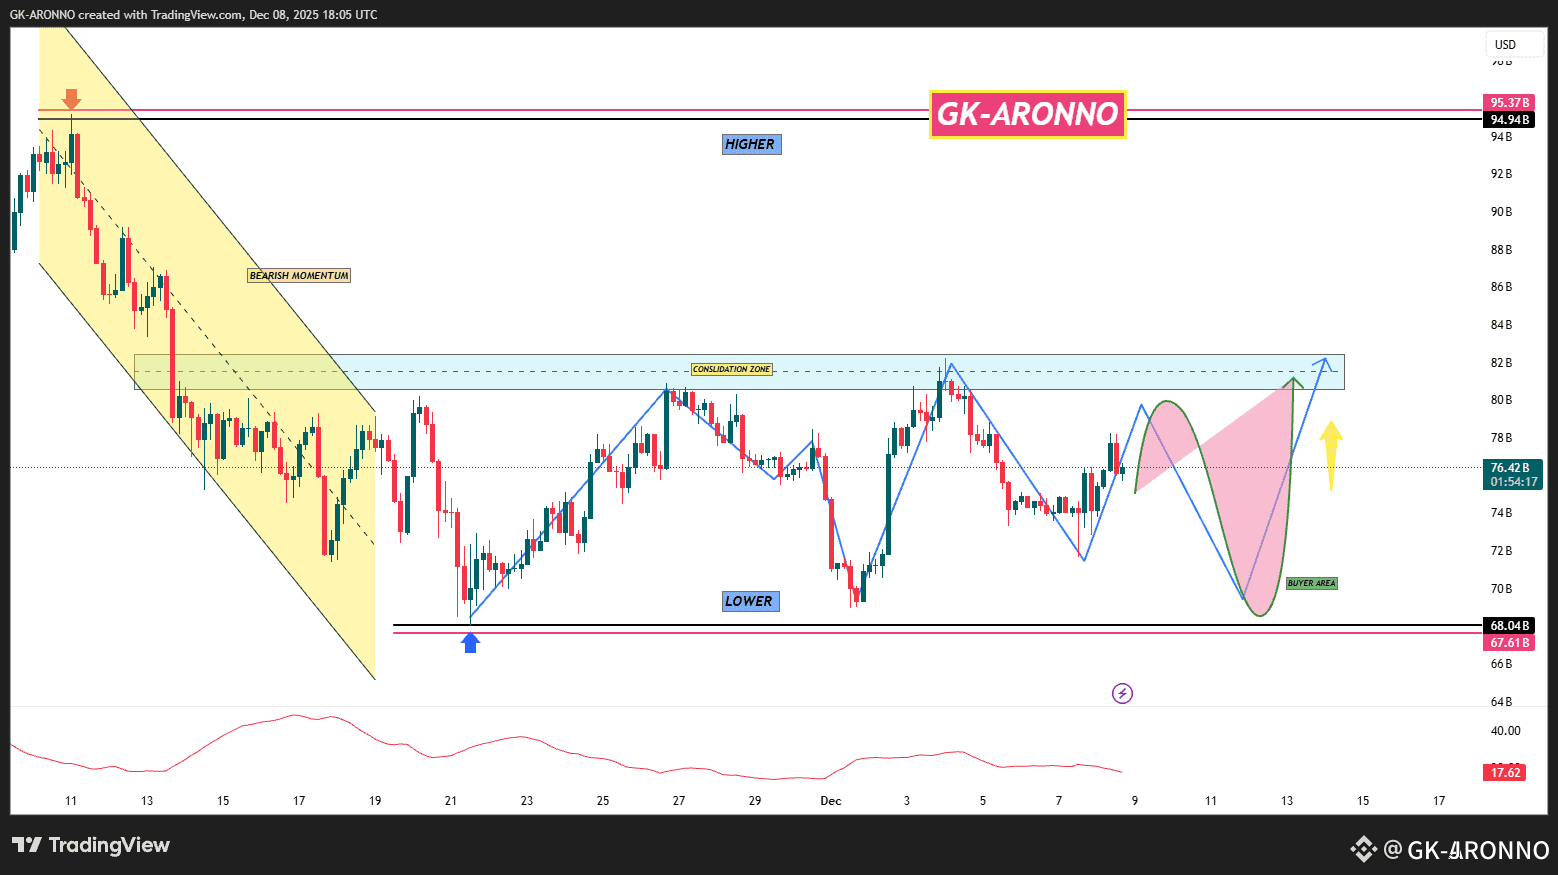
Price has transitioned from strong bearish momentum 📉 (left side descending channel)
into a range-bound / consolidation phase 📦.
Market is currently attempting to shift from bearish → neutral → potential bullish sentiment.
🔵 1. BEARISH MOMENTUM → BREAK OF STRUCTURE
The yellow descending channel shows clear bearish pressure.
A breakout from that channel signals the first sign of momentum weakening.
Price found a strong demand (buyer) area around the 67–68 zone 💎, forming a base (blue arrow).
🟢 2. RANGE / CONSOLIDATION ZONE (Key Zone 78–84)
Market is consolidating inside a horizontal supply/resistance zone between 78–84.
This is the decision zone where price gathers liquidity before the next major move.
Multiple liquidity grabs (equal highs & lows) inside this zone confirm accumulation/distribution behavior.
🔵 3. STRUCTURE SHIFTS: LOWER → HIGHER
The chart shows one strong higher low (HL) and a break above minor structure.
This suggests a bullish structural shift, but not confirmed until price closes above 83.50–84.
🟢 4. BUYER AREA & Expected Pullback
You marked a “Buyer Area” around 72–73, which aligns with:
FVG (Fair Value Gap) imbalance fill
Previous demand zone
HL formation area
This makes it a high-probability retracement zone for new long entries 👍.
📘 5. SHORT-TERM PROJECTION (Your curved path)
✔️ High-Probability Move
Price may first tap resistance at 82–84
Then perform a liquidity sweep (fake breakout)
Retrace sharply back into 72–73 buyer area 🟩
Before launching toward new highs if buyers defend that zone.
This is a classic:
Liquidity Grab → Deep Pullback → Continuation Pattern 🔄
🎯 6. KEY LEVELS TO WATCH
🔺 Resistance (Major Supply Zone)
84–85 (liquidity cluster + previous rejection zone)
94–95 (macro supply target)
🟩 Support (Strong Demand Zone)
72–73 (buyer area — optimal entry zone)
67–68 (macro support)
📈 7. SUMMARY — PROFESSIONAL OUTLOOK
✨ Bullish IF:
✔️ Price retests 72–73 and respects it
✔️ Breaks & closes above 84
⚠️ Bearish IF:
❌ Price breaks below 67
❌ Fails to hold the HL and re-enters the bearish structure
📌 FINAL TAKEAWAY
🧭 The chart shows transition from bearish → accumulation → potential bullish trend, but confirmation requires a breakout above 84 after the expected retracement.
The best long entry aligns with the 72–73 buyer zone, targeting 84, then 95 if momentum supports.
✅ Trade here on $SOL
