

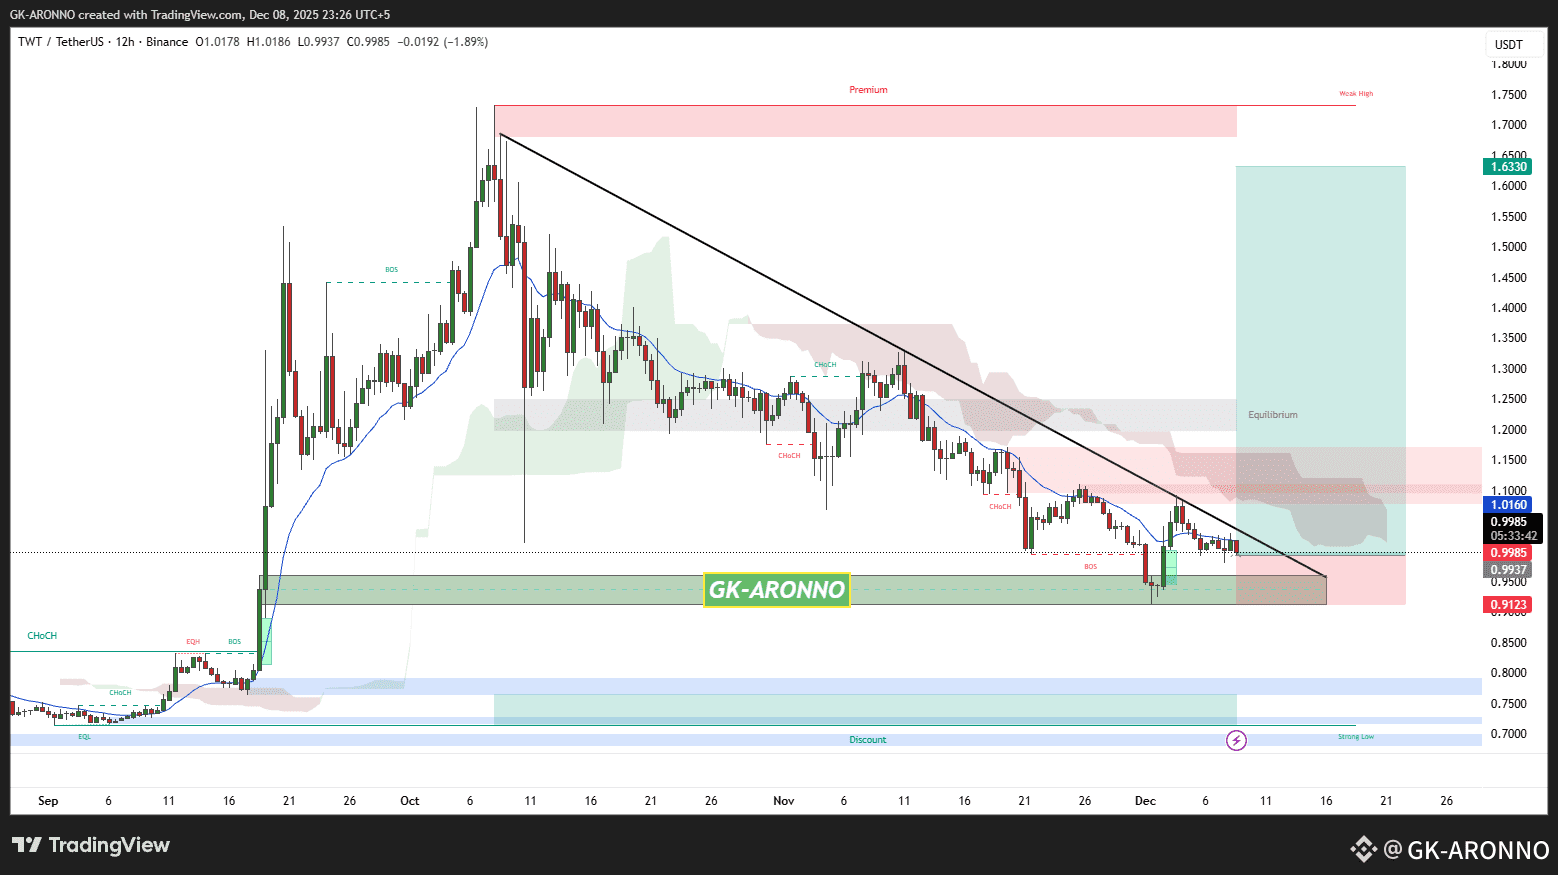
TWT/USDT on the 12-hour chart is still moving in a clear downtrend because price is trading below the descending trendline and also below the EMA, showing sellers are still controlling the market. Price is sitting inside a strong support demand zone around 0.95–1.00, and this zone has reacted before which means buyers are trying to defend it, but until the price breaks and closes above the trendline and 1.02–1.03 area with strength, upside continuation is not confirmed. If price keeps failing at the trendline it can stay weak and continue sideways or even push down toward the lower support area around 0.91, but if buyers manage to break out cleanly above resistance, then recovery toward higher levels becomes possible. Right now the structure is bearish but sitting on support where reaction can happen, so the next move depends on whether price breaks up from the trendline or gets rejected again.
✅ Trade here on $TWT
