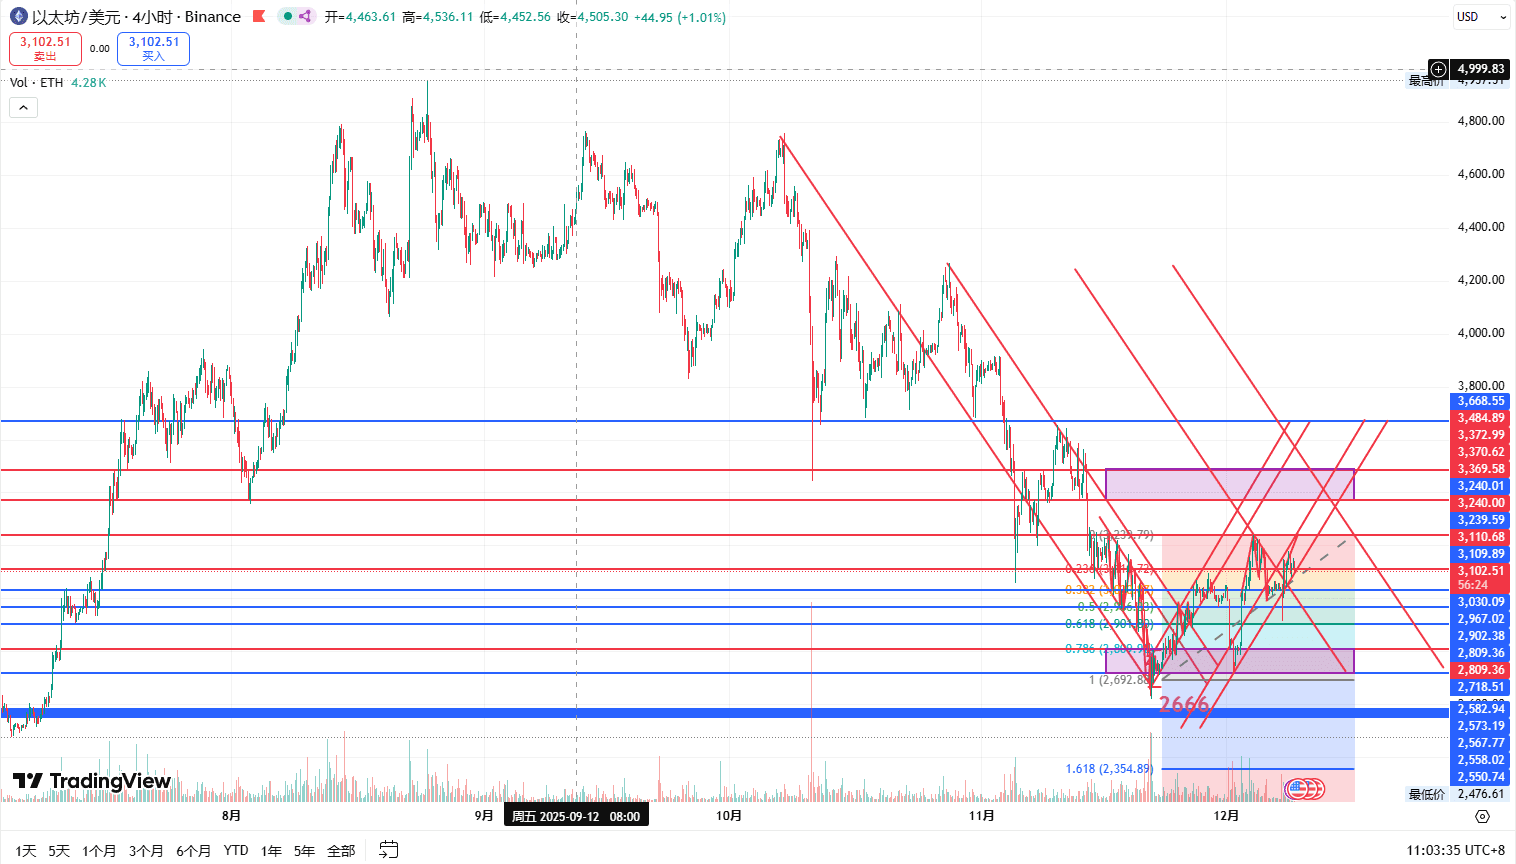
$ETH Currently showing a 4-hour level oscillation and stalemate, price anchored at the core center of 3110 USD, intense competition around key price levels, with clear core characteristics of the market.
Key price level system:
Central point: 3110 (core of short-term competition between bulls and bears)
Resistance level: 3239 (key defense line for medium-term bears, breakthrough needs volume confirmation)
Support zone: 3050-3100 (important defensive range for the current market)
Moving average structure signal:
Short-term moving average: 3054 forms support below, medium-term moving average follows price fluctuations.
Long-term moving average: 3239 continues to suppress price upward movement, showing a pattern of short and medium-term moving averages intertwining, with long-term moving averages under pressure, clearly indicating that the medium-term trend is still dominated by bears.
Order book characteristics: 3110 becomes the focus of long and short battles;
From the order book data, the 3110 range forms a significant long-short standoff;
In the 3110—3135 narrow range, buy and sell orders are densely accumulated, and capital games are intense;
The largest sell order reaches 67.637 ETH, placed at 3135.17, forming direct resistance against short-term upward movement; the balance of long and short forces is nearing equilibrium, and the short-term direction still needs to wait for a breakout signal.
Three scenarios for the short-term market;
Combining technical structure and capital movement, the short-term market likely presents the following three trends, requiring targeted responses:
Range oscillation (60% probability): The price repeatedly oscillates in the 3050-3239 USD range, with long and short forces relatively balanced, and transaction volume maintained at a low level, belonging to the energy accumulation stage before the trend becomes clear, testing holding patience. Blindly opening positions can easily lead to losses;
Volume breakout (25% probability): If buying funds continue to flow in, and the price breaks through the 3239 resistance level with a stable 4-hour closing price at that position, it will open up upward space, and the subsequent target looks to the 3300-3350 USD range, increasing the probability of a trend upward;
Breaking down (15% probability): If the bears push through the 3050 key support, short-term stop-loss orders will likely trigger and escape, and the price will likely test the 2980-3000 range, requiring caution against pullback pressure from chain reactions.
Practical trading strategy: Anchor signals, strictly control risks;
Strategy for holders;
If the cost of holding is below 3100: you can continue to hold, focusing on tracking the breakthrough of the 3239 resistance level. Before the breakout, you can moderately reduce positions in the 3200-3239 USD range, securing profits;
For heavy holders: Set a stop-loss at 3050, and immediately reduce positions after effectively breaking below, to avoid deep pullback risks after a trend break, retaining capital flexibility;
Rebounding to the 3200-3239 range: If volume does not expand simultaneously, it is recommended to actively reduce positions to avoid pullback risks near resistance levels.
Strategy for potential entrants;
Aggressive investors: Can lightly test long positions in the 3130-3140 range, keeping the position control within 10%, setting stop-loss below 3100 USD, and strictly controlling single trade risk;
Conservative investors: Need to wait for clear breakout signals - either follow up on longs after a volume breakout above 3239, or layout short positions when breaking below 3050 during rebounds. Do not blindly enter before confirmation signals appear.
Confirmation criteria for long and short signals;
Bullish confirmation signal (satisfying any one is sufficient);
A golden cross forms at the 15-minute level, and the short-term trend strengthens;
Transaction volume significantly expands, and the price stabilizes at 3239 USD;
Large sell orders around 3239 are continuously canceled, selling pressure eases, and buying support strengthens.
Bearish confirmation signal (watch out for any occurrence);
The price breaks below 3100, and the 1-hour closing price fails to recover that range;
The rebound high point gradually declines, forming a prototype of a descending channel, and bullish momentum wanes;
The 30-minute level indicator shows a top divergence, and the short-term pullback risk is rising.
Key points for risk control;
Linked risks: $BTC as a market barometer, need to monitor its 91000 support level closely. If BTC breaks below that price level, ETH will likely follow with a pullback, requiring advance risk control.
Opening position taboo: Avoid blindly opening positions in the 3130-3150 range, as this area is a long-short meat grinder, with severe fluctuations and unclear direction, easily leading to both-sided losses;
Capital management: Strictly enforce stop-loss discipline, with a single trade loss not exceeding 2% of total funds, eliminate no-stop-loss operations, and ensure risks are controllable;
Core conclusion;
Currently $ETH is in the 3050-3239 key range competition phase, with short-term direction not yet clear, and the medium-term trend still leaning bearish.
Stabilizing at 3239 USD with volume can lead to following up on long positions;
Effectively breaking below 3050 USD requires decisive layout of short positions or reducing positions for risk aversion;
In the range oscillation phase, mainly observe and patiently wait for clear signals; it is better to miss out than to make mistakes.
Before the trend becomes clear, position control and patient waiting are key to profitability. There is no need to get tangled in short-term fluctuations; focus on breakthrough and breakdown signals at core price levels.
Pay attention to San Shu, who analyzes Ethereum trends and shares market insights daily.