This is the BTC annual candlestick chart using a logarithmic scale, which reflects the percentage change in BTC's price over the year, rather than absolute price changes. From this chart, can you see any problems, my friends? Let me throw out a brick to attract jade...
First, the most intuitive thing is that BTC has consistently followed the 4-year bull-bear cycle over the past 15 years, as indicated by the '3-4-1-2' marked in the chart for one cycle, maintaining a rhythm of 3 bullish candles and 1 bearish candle, where 3-4-1 represents bullish candles (bull market) and 2 represents a bearish candle (bear market).
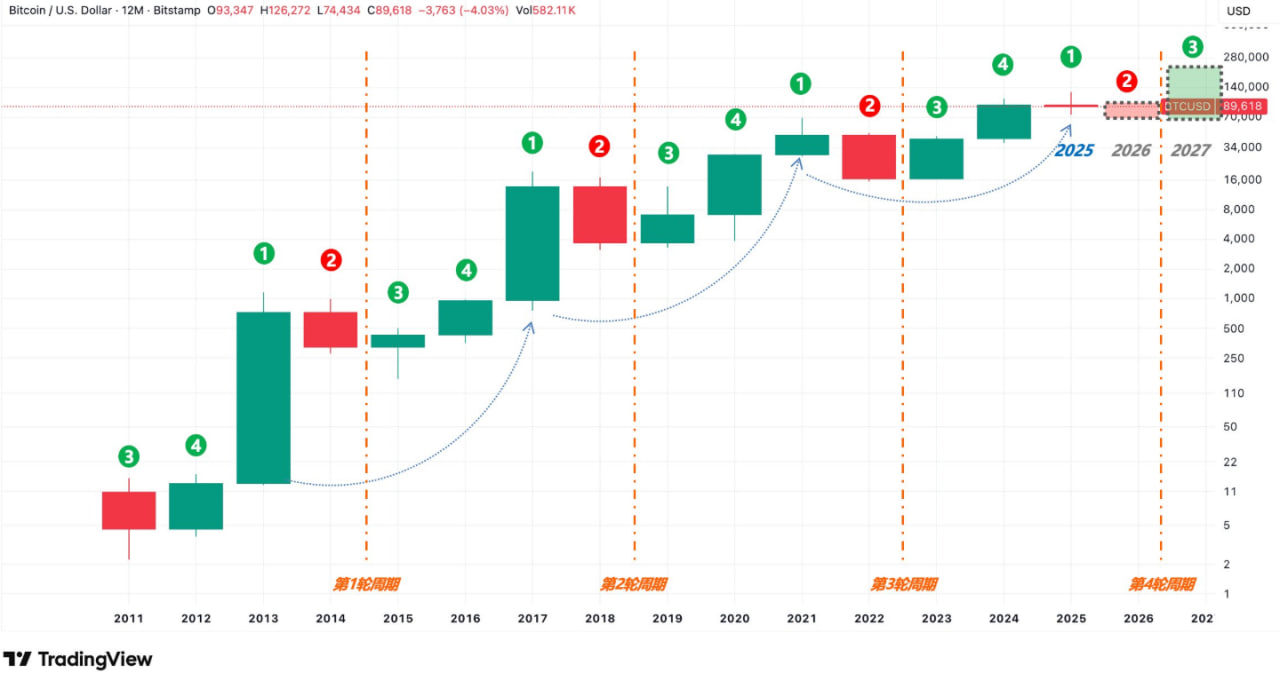
Secondly, if we compare the three candlesticks from 2013, 2017, and 2021 individually (the blue dashed line in the chart), we can see that '1' is getting shorter, indicating that the increase is becoming smaller. And exactly in 2025 is '1'.
According to the pattern, originally 1 should be a bullish candle (green bar), however, now we still see it as a bearish candle (red bar); BTC needs to close above $93,347 at the end of December for it to be a bullish candle. But even so, it is still a doji, which has never occurred in history (previously it was always a bullish candle with a body).
If the closing in December is below $93,347 and a bearish candle forms, it further indicates that the previous 4-year bull-bear cycle time point has been broken! This means that the '2' in 2026 may not necessarily be a bearish candle.
At the same time, we observe that '2' is also getting shorter, indicating that regardless of how 2025 ultimately turns out, 2026 is likely to just be a small segment of a bearish or bullish candle, meaning the decline or increase is not significant. Moreover, if 2025 closes as a bearish candle, following the past pattern of not having two consecutive years of bearish candles, 2026 is more likely to close as a bullish candle.
Additionally, both '1' and '2' are getting shorter, while only '3' is getting longer. So, could it be that the increase in 2027 is the most significant, and by 2028 the body of the K-line becomes smaller, and in 2029 it turns into a bearish candle...
It seems that the BTC cycle still exists, but the timing does not align with past patterns. In the future, it may not necessarily be a four-year conversion, giving the impression that 'the cycle has accelerated, and the increase has diminished.'
The reason I bring this chart up is that I believe it contains both logic and metaphysical elements, and it is correlated with our 'Three Line Integration' indicator.
If 2026 continues to close as a bearish candle, its body getting smaller has another reason: part of the decline has already been absorbed by 2025, meaning the cycle time is becoming increasingly 'advanced'. Thus, based on past timing patterns, we expect that the bottom of the bear market in 2026 Q3-Q4 may also come earlier.