

The price of Zcash (ZEC) extended its gains on Wednesday after rising by about 30% so far this week.
Derivatives data shows a bullish picture as open interest for ZEC rises, with bullish bets reaching a monthly high, and funding rates turning positive.
Technical forecasts indicate that the rally may continue, with ZEC aiming to move above $485.
Zcash's price ($ZEC ) extends gains, trading above $440 on Wednesday after rising about 30% so far this week. The increase in open interest for ZEC, high bullish bets, and the shift to positive funding rates all point to stronger demand. Technically, forecasts indicate further gains, with bulls targeting levels above $485.
ZEC derivatives data shows a bullish bias
CoinGlass data shows that the open interest for ZEC futures on exchanges rose from $701.11 million on December 3 to $954.87 million on Wednesday, the highest level since November 29. The increase in open interest represents new or additional funds entering the market and new buying, which may fuel the current rise in ZEC's price.
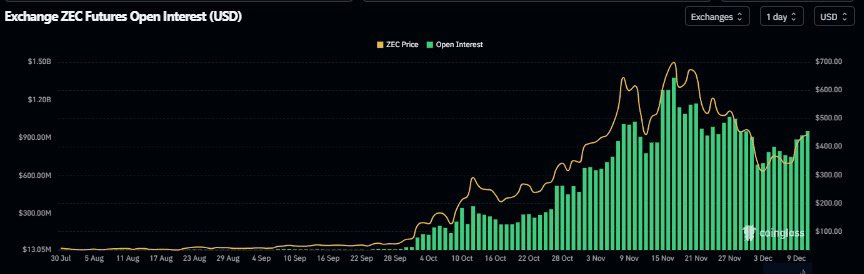
Chart of open interest for ZEC. Source: Coinglass
Additionally, the buy-to-sell ratio for $ZEC from CoinGlass reads 1.08, the highest level in a month. A ratio above one indicates that more traders are betting on an increase in Zcash's price.
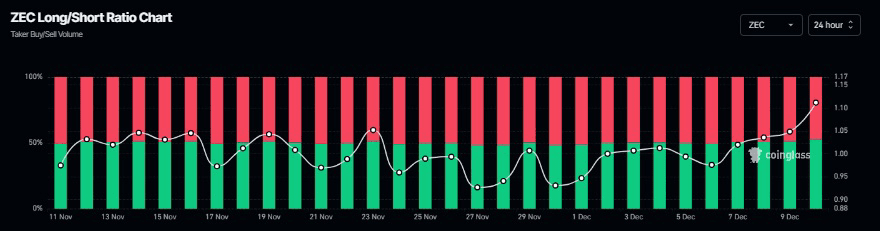
Chart of the buy-to-sell ratio for ZEC. Source: Coinglass
Aside from the increase in open interest and bullish bets, CoinGlass's weighted funding rate data shows that the number of traders betting on a decline in ZEC's price is fewer than those expecting an increase in price.
This metric turned positive on Saturday and reached 0.0059% on Wednesday, indicating that long positions are pushing short positions. Historically, as shown in the chart below, when funding rates shift from negative to positive, the price of Zcash rises sharply.
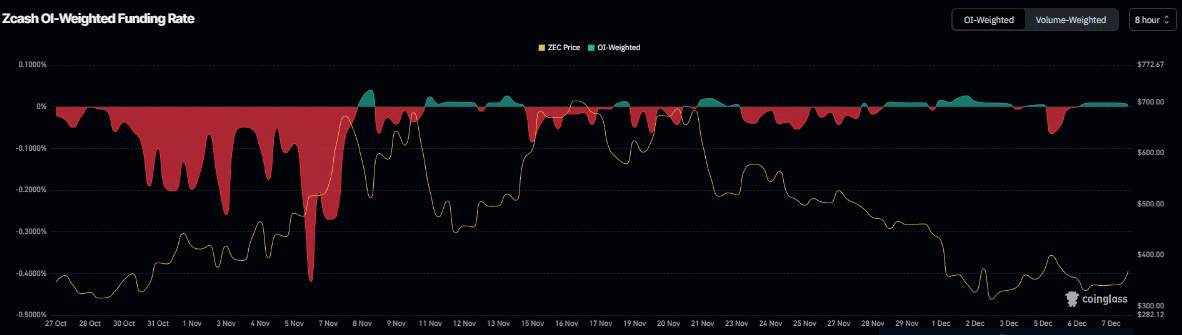
Chart of the funding rate for Zcash. Source: Coinglass
Zcash price forecast: bulls targeting above $485
The price broke $ZEC above the descending trendline (drawn by connecting several peaks since November 20) on December 5. However, it failed to maintain the upward momentum and retraced the next day, finding support around the trendline. On Monday, at the start of the week, ZEC rose over 19% and continued to climb until Tuesday. As of this report on Wednesday, ZEC continues its gains, trading above $440.
If ZEC continues its upward trend, it may extend its rise towards the next major resistance at $485.18.
The Relative Strength Index (RSI) on the daily chart is moving above the neutral level of 50, indicating a waning bearish strength and the onset of bullish momentum signs. Furthermore, the Moving Average Convergence Divergence (MACD) is about to complete a bullish crossover. If confirmed, it will reinforce the bullish hypothesis.
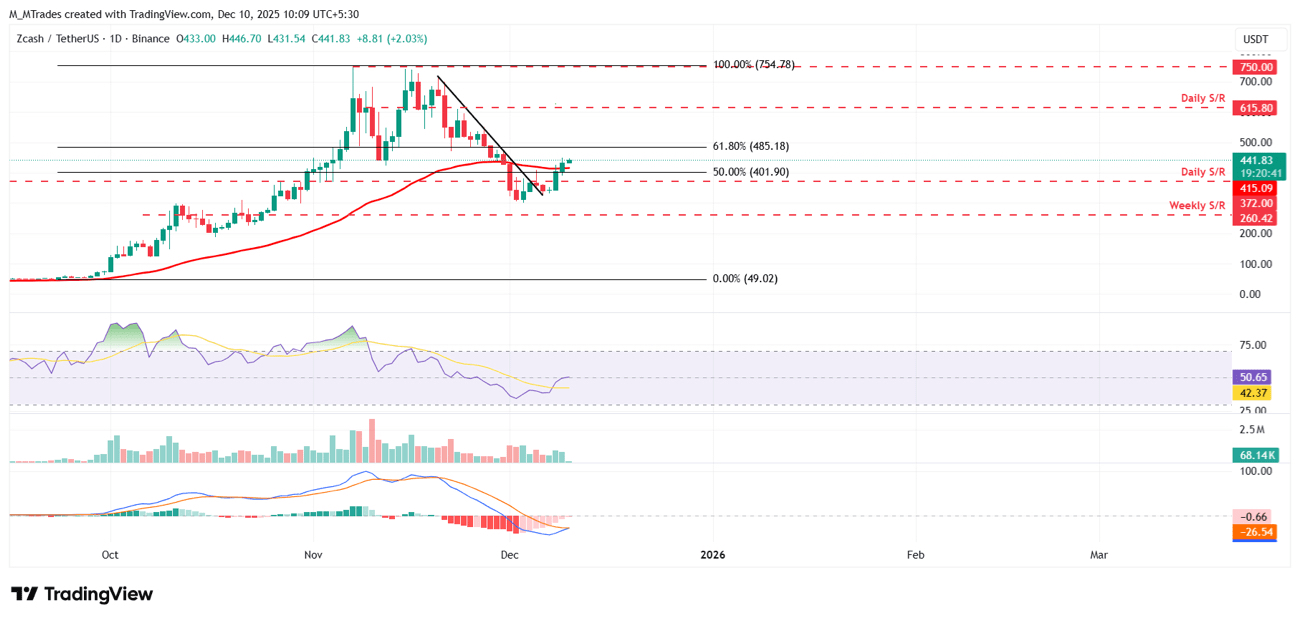
Daily chart for ZEC/USDT
On the other hand, if ZEC faces a correction, the decline may extend towards daily support at $415.
#ZEC #ZCACH #ZEC.24小时交易策略 #BinanceSquareFamily #BinanceSquare