Looking at the latest 1-Day (1D) chart for ASTR/USDT, the market is clearly trying to find its direction after a sharp pullback. Here’s what’s happening:
🔹 Current Price & Market Mood
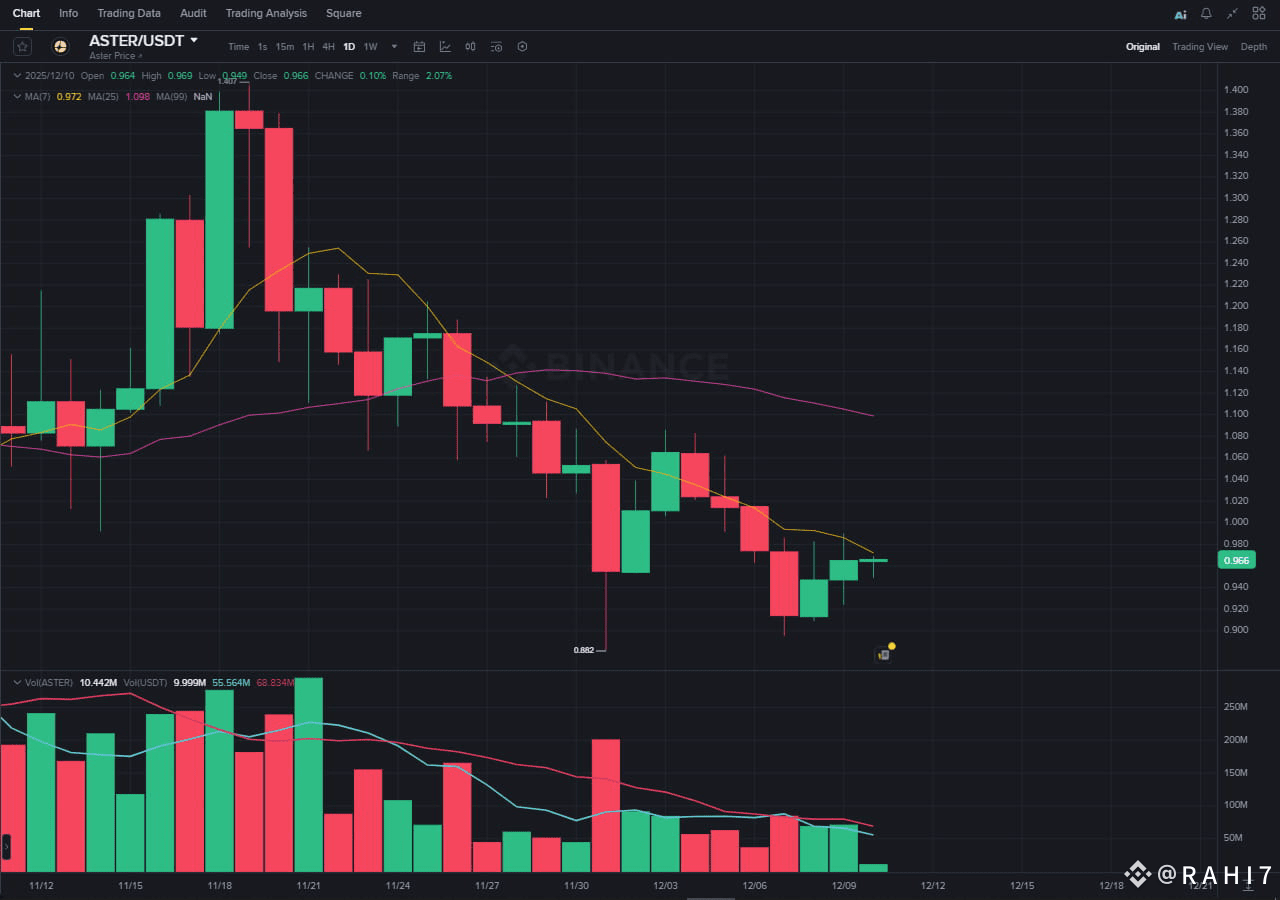
ASTR closed around $0.966, slipping under the psychological $1 level, which often acts as a confidence barrier for traders. Dropping below it naturally builds some bearish sentiment.
🔹 Below Key Moving Averages
Right now, ASTR is trading under both the MA(7) ($0.972) and MA(25) ($1.058):
Being below MA(7) shows weakness in short-term momentum.
Being below MA(25) confirms that the medium-term trend is clearly bearish.
This combination usually signals that buyers have stepped back while sellers remain in control.
🔹 MA(7) — The First Test
The price is sitting very close to the MA(7).
If ASTR can close above this line, it would hint at the first sign of a short-term recovery — something traders will be watching closely.
🔹 MA(25) — The Real Battle Zone
Even if ASTR breaks above the MA(7), the bigger test is the MA(25) at $1.058.
Reclaiming this level is essential for any meaningful trend reversal.
Until that happens, the market remains under bearish pressure.
🔹 Critical Support at $0.882
This is the most important zone on the downside.
A clean breakdown below $0.882 could open the door for deeper corrections, so bulls must defend this level strongly.
🔹 Volume Weakness
Recent selling volume has slowed down, but buyers are still not stepping in with conviction.
That’s why the price is failing to show stability even with lower sell pressure — a sign of hesitation on both sides.
🎯 Key Takeaway
ASTR is stuck in a challenging structure. For any bullish momentum to return:
1️⃣ Price must close above MA(7) ($0.972)
2️⃣ Then reclaim the MA(25) ($1.058)
Failure to do so keeps the market vulnerable, especially if $0.882 comes under pressure again.
📌 Disclaimer: Not financial advice. Always DYOR.