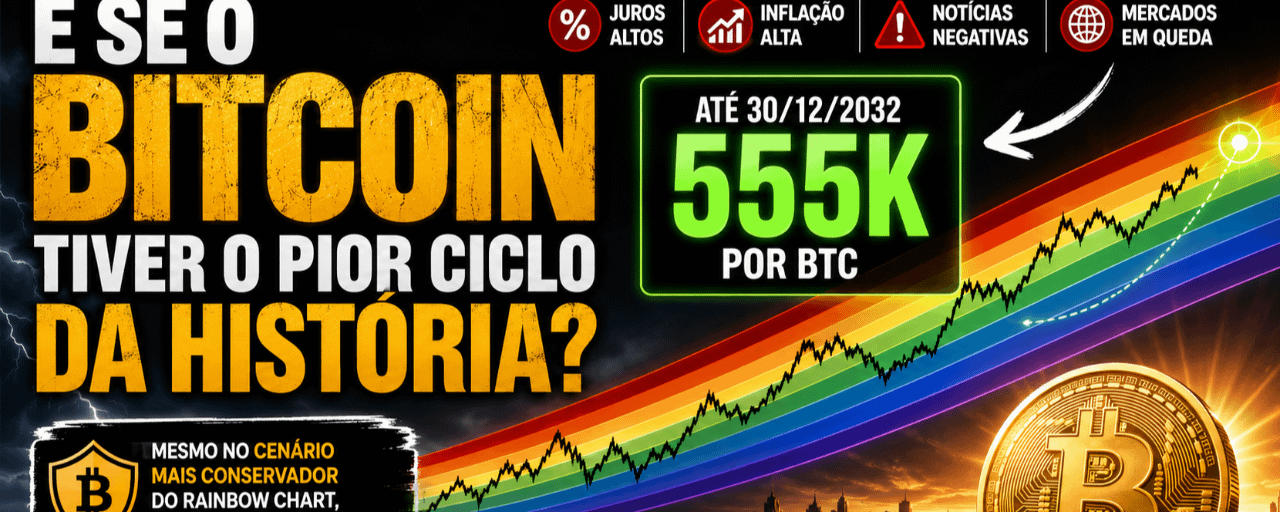
Even in the most conservative scenario of the Bitcoin Rainbow Chart, BTC could reach around $555,000 by the end of 2032.
📈 This represents an appreciation of over 8x compared to current prices.
💡 What's interesting is that this scenario doesn't assume extreme euphoria, explosive adoption, or speculative bubbles. It only considers the continuation of Bitcoin's long-term historical trend.
Even in a scenario of high interest rates, persistent inflation in the US and globally, along with negative news for financial markets, the lower range of the Bitcoin Rainbow Chart suggests a gradual appreciation trajectory until 2032.
This doesn't mean there won't be corrections or periods of high volatility. What the model suggests is that, if the long-term historical trend continues, Bitcoin could keep pushing forward over the next few years, even without euphoria cycles.
The reasons can be diverse:
✅ Retail investors will continue to accumulate Bitcoin as a store of value.
✅ Companies and institutions are likely to expand their positions over time.
✅ Long-term holders play a crucial role in reducing the available supply in the market.
✅ New companies focused on Bitcoin, financial products, infrastructure, and technology could generate additional economic value for the entire ecosystem.
With each cycle, Bitcoin becomes scarcer, more recognized, and more integrated into the global financial system.
If even the most conservative scenario indicates values above half a million dollars per BTC by the end of 2032, it's worth reflecting on what the potential could be in more optimistic scenarios.
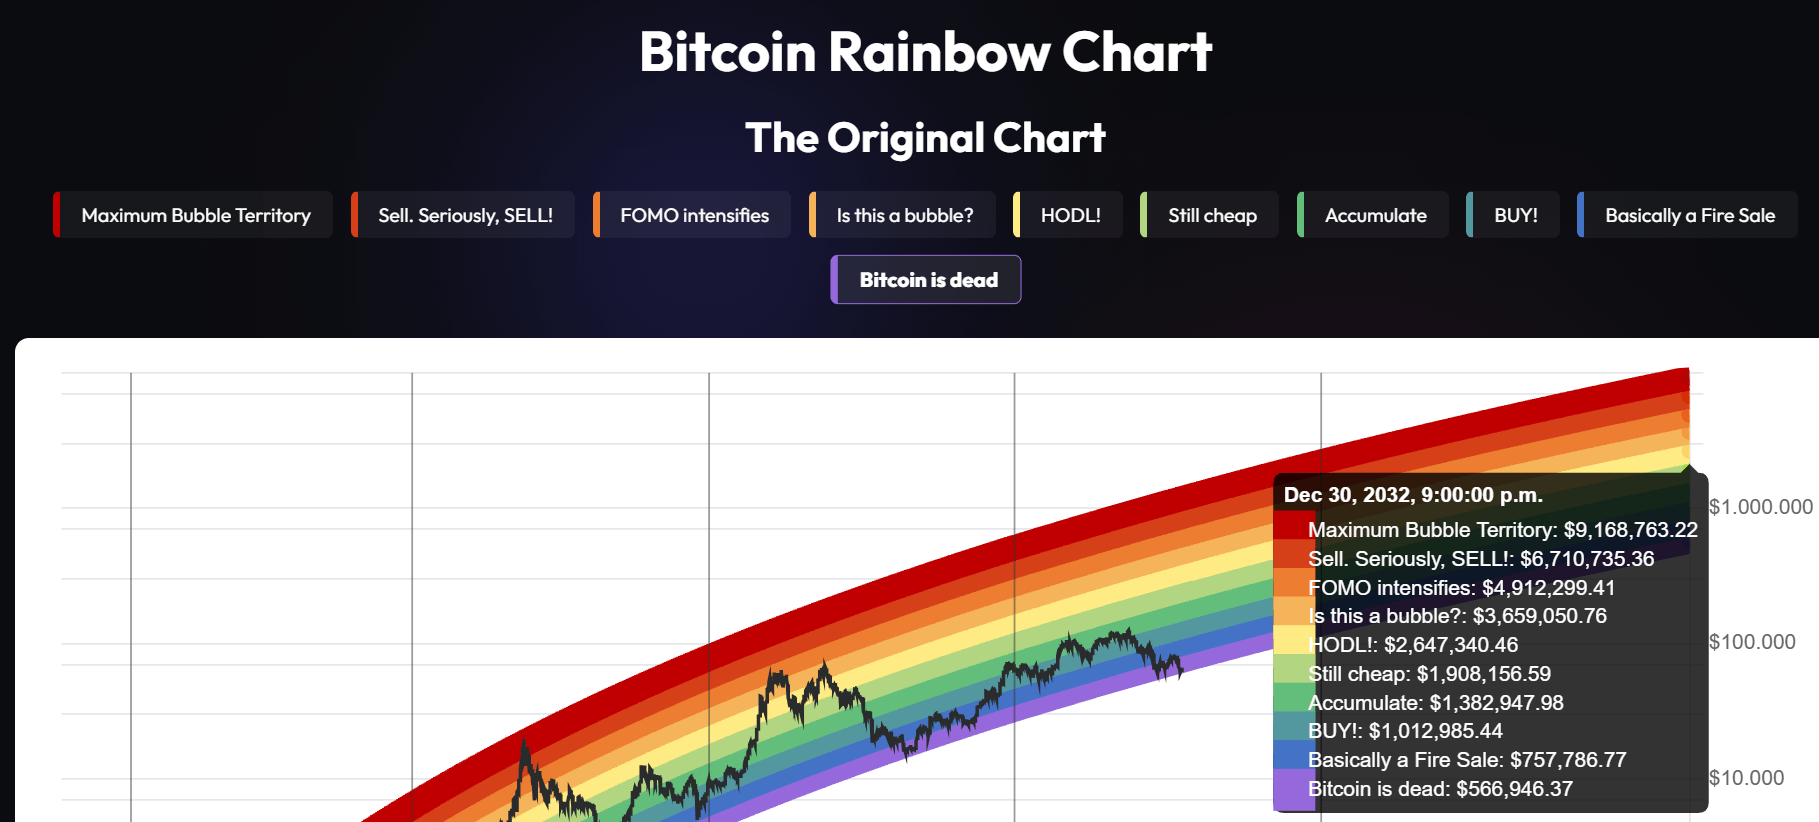
⚠️ Of course, the Rainbow Chart is not a guarantee of the future. It's just a statistical model based on Bitcoin's historical trajectory.
But it raises an interesting question:
If the worst-case scenario points to over half a million dollars per BTC in 2032, what could be the potential in optimistic scenarios?
According to this indicator, the maximum bubble could hit 9 million per BTC by the end of 2032! 🌽🌽🌽🌽🌽🌽🌽🌽🌽