Ethereum has failed to show a proper recovery pattern, leading the market in the wrong direction, and overall, the situation is unlikely to improve.

After the sharp decline in prices of various assets, including Ethereum, the market's bullish sentiment has clearly reversed. Ethereum rebounded quickly and decisively after a fake breakout and declining volume. Other assets are unlikely to follow suit, except for Bitcoin (if it rebounds here).
Has the Shiba Inu protest ended?
Although the title bluntly claims that the Shiba Inu price rally has ended, the chart indicates that the current situation does not support this conclusion. What we see is a weak market, an undeniably bearish structure, and every time the Shiba Inu price attempts to rise, the momentum continues to weaken.
However, dead assets exhibit different behavioral patterns, losing liquidity and no longer forming regularities, becoming aimless. These situations do not apply to SHIB.
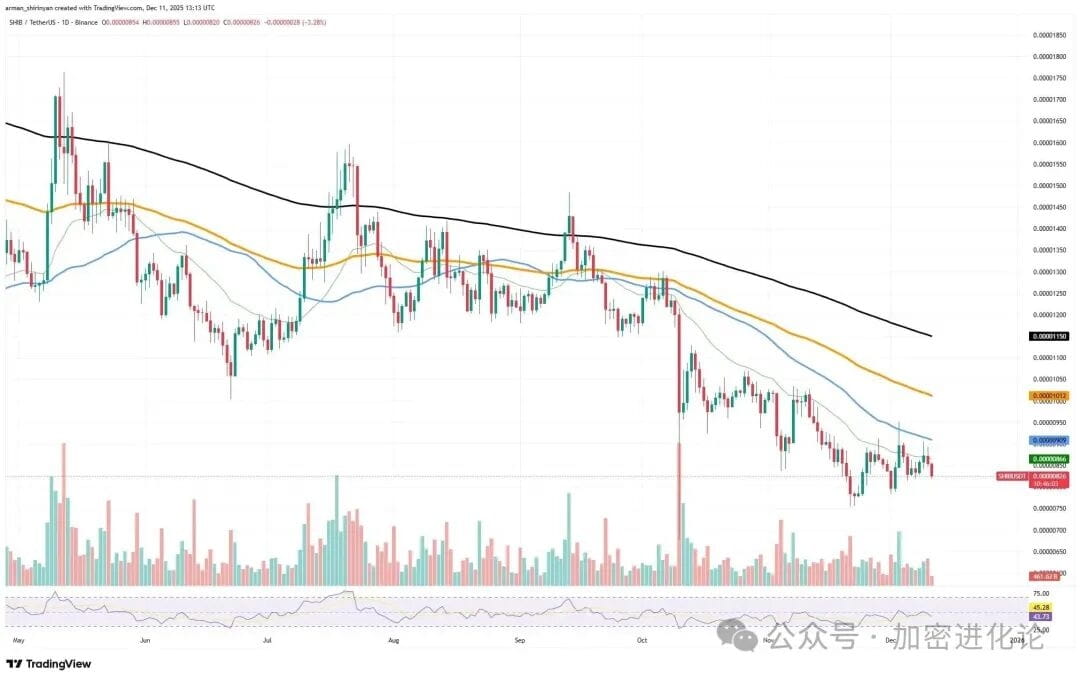
The 50-day moving average, 100-day moving average, and especially the 200-day moving average are all major moving averages that SHIB's current trading price is far below. This stacking of moving averages indicates a long-term downward trend and significantly reduces the likelihood of a price reversal occurring in the short term. The resistance encountered near the 50-day moving average indicates that sellers still fully control the market, and the demand at the resistance level is insufficient to absorb these sellers' sell-offs.
Trading volume continues to shrink. Even on the best days, buyer enthusiasm is lacking, which is problematic because any attempt to break through relies on increased trading volume. SHIB fails each time it tries to break through the $0.0000090 area, indicating that the market is not yet ready to break this pattern.
The Relative Strength Index (RSI) also confirms this, currently around 40: weak momentum and lack of confidence. However, weakness does not mean death.
SHIB's price movements continue to align with the overall sentiment of the altcoin market, reacting to support levels and attracting speculative funds during declines. This suggests that diversification may be the next developmental direction. If SHIB breaks below the support level of $0.0000080-$0.0000083, it could drop to the midpoint of $0.0000070. This would be the first time in months that this structure faces a more severe collapse risk.
If SHIB stabilizes and retests the 50-day moving average, a breakthrough may quickly change market sentiment, but this will only happen if trading volume eventually appears. Otherwise, it will just be another failed bounce.
Ethereum's brief upward trend ends
Ethereum recently exhibited a trend that typically signals the end of a brief upward trend: a noticeable attempt to break through resistance, only to be rejected and experience a sharp reversal, almost instantly erasing the gains.
This is a typical false breakout, and this time the blow is particularly severe. The descending structural trend line, the 50-day moving average, and the 100-day moving average together form the upper resistance level for Ethereum's price. However, before buyers could take control of the situation, Ethereum was pulled back sharply.
Healthy continuation trends do not exhibit such reactions. When market momentum is strongly bullish, the closing price of the candlestick will be above the resistance level, trading volume will increase, and the resistance level will be decisively broken. However, what we see this time is the opposite: declining volume during the upward process, and strong selling immediately after the price hits the resistance level. When upward momentum weakens and large holders sell, this phenomenon in price movements occurs.
Historically, false breakouts of this magnitude often foreshadow deeper pullbacks or prolonged consolidations, especially when occurring below multiple exponential moving averages (EMA). The 50-period EMA and 200-period EMA, which acted as dynamic resistance during this decline, are currently still below ETH's trading price. Until the price genuinely closes above these EMAs, every rebound carries structural risk.
However, optimism still exists and shows no signs of weakening. Ethereum has absorbed several weeks of selling pressure, creating higher lows, indicating that buying pressure remains strong enough to push prices through resistance areas. The market did not collapse after experiencing sell-offs but instead stabilized. The Relative Strength Index (RSI) has not overextended, indicating that market sentiment has not worsened.
If Ethereum can hold the support range of $3050 to $3150 and attempt to break through again near the 50-day moving average with increased trading volume, the next round of breakthroughs may occur. Once the 50-day and 100-day moving averages rebound effectively, market trends will immediately reverse, paving the way for prices of $3500 and higher.
The possibility of Bitcoin's recovery
Despite the weak market performance last month, Bitcoin has not given up on its determination to reach the long-term target of $100,000. This is clearly evident from the chart structure: Bitcoin has formed a rising local support line below the current price, and the significance of this trend line is greater than it appears on the surface.
Whenever sellers try to push the market price down, buyers always intervene when the price is blocked at the bottom support level. This is exactly the phenomenon people expect when the macro target of $100,000 is still valid.
Bitcoin is still trapped by dense moving averages. The overlap of the 50-day, 100-day, and 200-day moving averages creates a multi-layered resistance above the market. However, it is crucial that Bitcoin has not collapsed. It has not yielded but has made controlled pullbacks after each decline. This is an accumulation behavior, not a distribution behavior.
If the market is preparing for further declines, these bounces will not last, and the uptrend line has long been invalidated. With the Relative Strength Index (RSI) in the neutral zone, Bitcoin's buying and selling pressure is not significant. This is very favorable for the market to build a bottom.
The market is quietly laying the groundwork for another attempt to break through $95,000 and enter the six-figure resistance zone, while the stable distribution of trading volume also indicates the realization of this goal; there is no panic selling, nor exhausting surges.
There is no doubt that regaining $100,000 is no easy task. The upper moving averages must be decisively broken. Bitcoin's failure to break below its rising support level indicates that the market is still anticipating a wave of upward momentum. As long as this trend line remains intact, Bitcoin still has the potential to welcome a new round of increases.


