
Bitcoin is generally trending towards consolidation as the Federal Reserve's cautious stance on future interest rate cuts affects the cryptocurrency markets.
Institutional demand for Bitcoin indicates a slight increase in Bitcoin exchange-traded funds as Strategy 10K adds another Bitcoin to its holdings.
The price of Bitcoin is approaching a downward trend line, which if broken, could open the door for a new rally.
Bitcoin ($BTC ) continues to trade within the recent consolidation phase, hovering around $92000 at the time of this report on Friday, while investors are scrutinizing the Fed's cautious interest rate cut in December and its effects on risky assets. The price movement of Bitcoin is approaching a key downward trend line that may dictate its next directional move. At the same time, institutional flows into spot Bitcoin ETFs have shown slight inflows, and Strategy Inc. has added more Bitcoin to its treasury reserve.
The tone of the Federal Reserve's policy stimulates Bitcoin's coherence.
Bitcoin started the week positively, extending its recovery over the weekend in the first half of the week and settling above $92600 on Tuesday. However, momentum waned on Wednesday, with Bitcoin closing at $92015 after the Federal Open Market Committee (FOMC) meeting. In a widely expected move, the Federal Reserve cut interest rates by 25 basis points to 3.50%-3.75% but indicated a potential pause in January.
In addition to the cautious tone, policymakers expect only a quarter-point reduction for 2026 in total, which is the same forecasts as in September, easing market expectations regarding two rate cuts and contributing to pressure on risky assets in the short term.
The cautious tone from the Federal Reserve, coupled with disappointing Oracle results, contributed to a short-term move to risk aversion. All these factors affected the riskiest assets, with the largest cryptocurrency by market cap dropping to a low of $89260 before bouncing back to close Thursday above $92500.
With no major U.S. data releases on the horizon, cryptocurrency markets will now look to speeches from members of the Federal Open Market Committee and general sentiment toward risk to determine the trend heading into the weekend. Bitcoin is likely to consolidate in the near term unless a major catalyst emerges.
Uncertainty regarding Russia and Ukraine limits risk momentum.
On the geopolitical front, U.S. President Donald Trump said he is "very frustrated" with Russia and Ukraine and does not want to talk more, according to his spokesperson on Thursday. Earlier, Ukrainian President Volodymyr Zelensky stated that the U.S. was pushing the country to concede territory to Russia as part of a deal to end a nearly four-year-long war. These ongoing geopolitical tensions and stalled peace talks continue to affect global sentiment toward risk, limiting risk appetite and contributing to Bitcoin's resilience so far this week.
Institutional demand shows signs of slight improvement.
Institutional orders for Bitcoin show signs of slight improvement. According to SoSoValue data, U.S.-listed spot Bitcoin ETFs recorded a total inflow of $237.44 million as of Thursday, after a slight outflow of $87.77 million in the previous week, indicating that institutional investor interest has improved somewhat. However, these weekly inflows remain small compared to those observed in mid-September. For Bitcoin to continue its recovery, ETF inflows must increase.
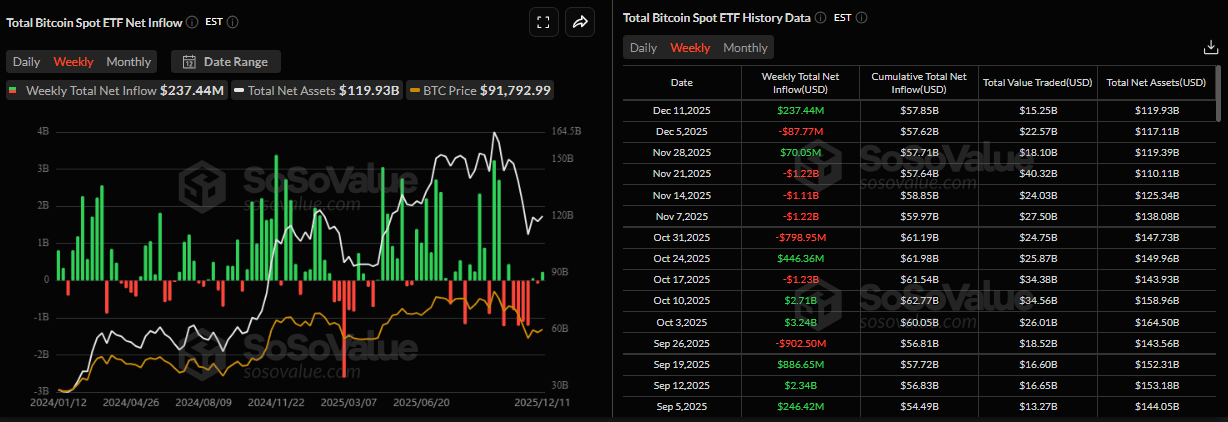
A chart of net inflows of Bitcoin ETFs. Source: SoSoValue
On the institutional front, Strategy Inc. (MSTR) announced on Monday that it purchased 10624 bitcoins for $962.7 million between December 1-7 at an average price of $90615. The company currently holds 660624 bitcoins, valued at $49.35 billion. According to a post by Walter Bloomberg X, Strategy still retains a significant capacity to raise additional capital, which may allow for large-scale Bitcoin accumulation in the future.
On-chain data shows a retreat in selling pressure.
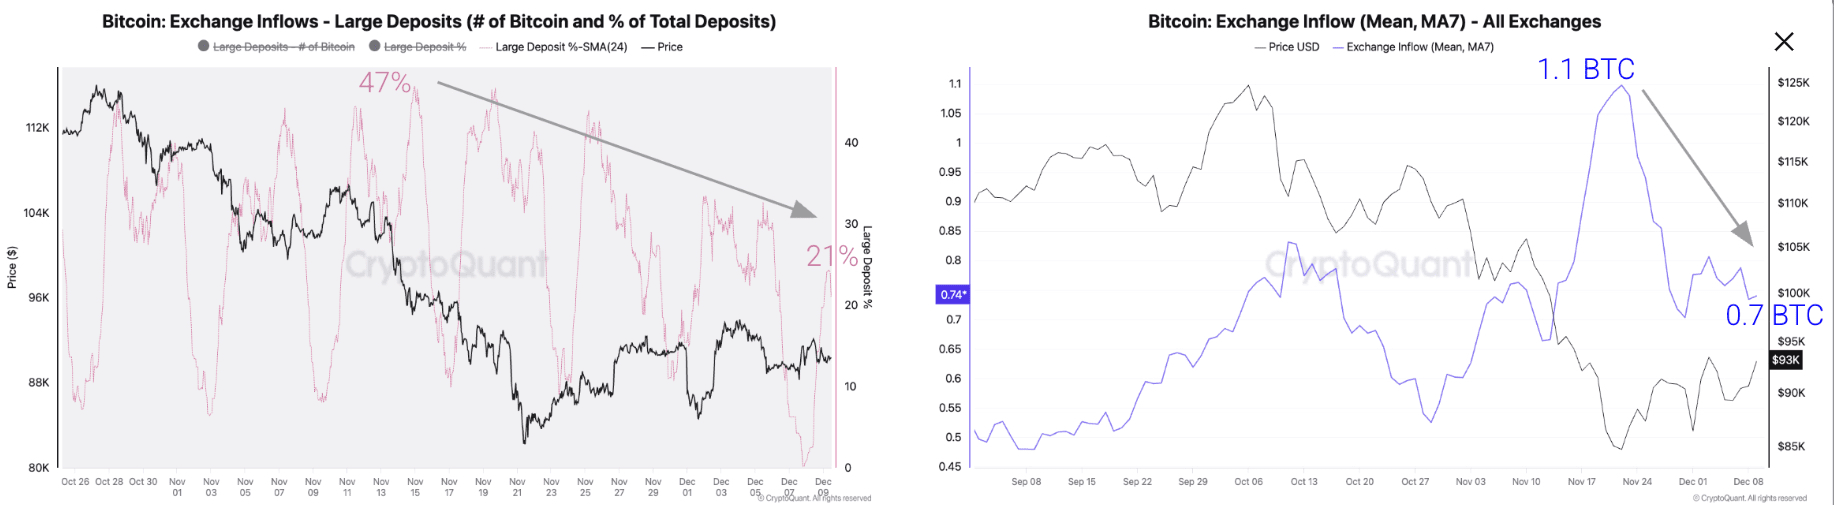
The CryptoQuant weekly report on Wednesday highlights that selling pressure on Bitcoin has begun to ease.
The report indicates that deposits on exchanges have declined as major players have reduced their transfers to exchanges. The chart below shows that the total deposit share from major players has dropped from a high 24-hour average of 47% in mid-November to 21% as of Wednesday. At the same time, the average deposit decreased by 36%, from 1.1 bitcoins on November 22 to 0.7 bitcoins.
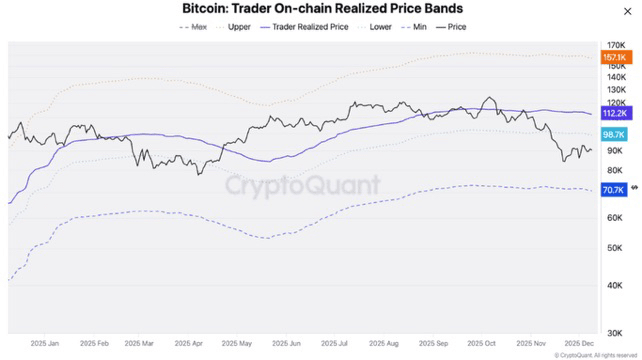
 CryptoQuant concludes that if selling pressure remains low, it could drive Bitcoin's recovery to $99000. This level is the minimum of the perceived Bitcoin price ranges on-chain, serving as price resistance during bear markets. After this level, the main price resistances are $102000 (one-year moving average) and $112000 (perceived Bitcoin price on-chain).
 Copper Research's report also noted optimism regarding Bitcoin. The report suggests that the four-year Bitcoin cycle has not ended; rather, it has been replaced. Since the launch of spot ETFs, Bitcoin has shown repeatable return cycles, as illustrated in the chart below.
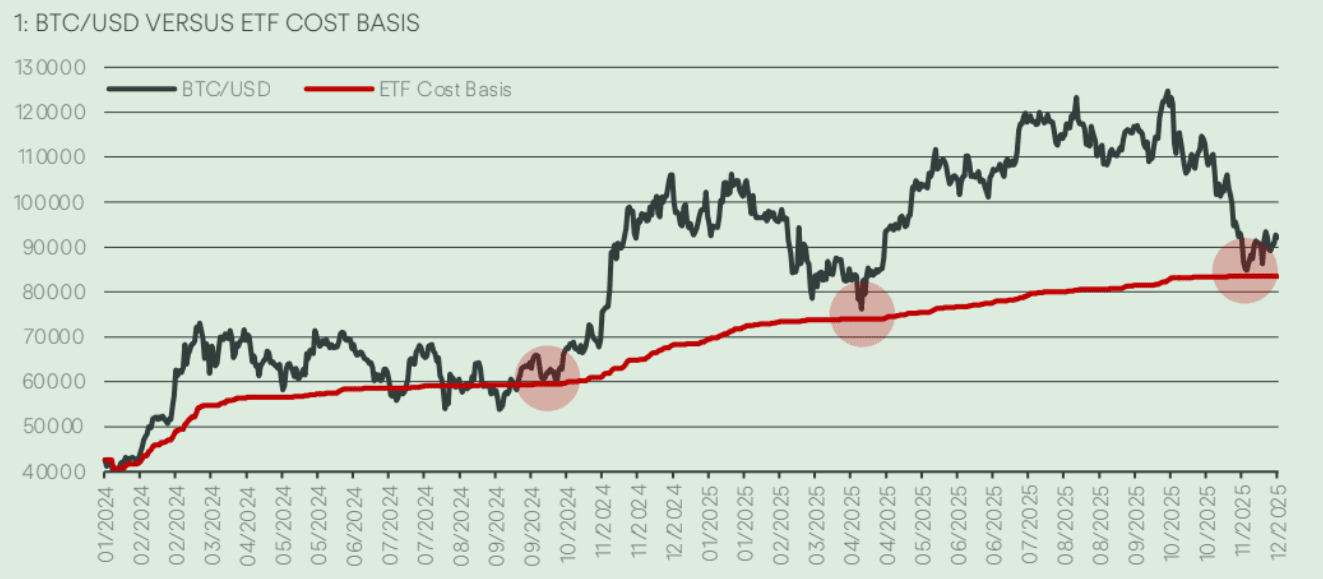
Fadi Abu Alif, head of research at Copper, told FXStreet: "Since the launch of spot ETFs, Bitcoin has moved in repeatable mini cycles where it retraces to its cost basis and then rallies by about 70%. With Bitcoin now trading near its cost basis of $84000, this pattern suggests a move above $140000 in the next 180 days. If the cost basis rises by 10-15% as in previous cycles, the resulting premium seen at past peaks yields a target range of $138000-$148000."
Are we witnessing a Christmas rally?
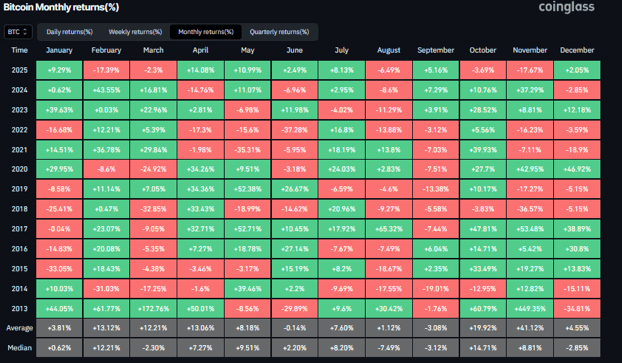
Bitcoin recorded a loss of 17.67% in November, disappointing traders who expected a recovery based on its strong historical returns for this month (see CoinGlass data below). Historically, December has been a positive month for Bitcoin, with an average return of 4.55%.
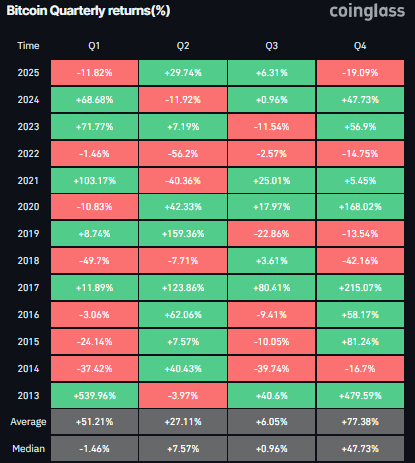
Looking at quarterly data, the fourth quarter (Q4) has been the best quarter for Bitcoin overall, achieving an average return of 77.38%. However, performance in the last three months of 2025 has been disappointing so far, with a loss of 19% to date.
Is Bitcoin finding a bottom?
The weekly Bitcoin chart shows that the price is finding support around the 100-week exponential moving average (EMA) at $85809, with two consecutive green candles recorded after a four-week correction that began in late October. As of this week, Bitcoin is trading slightly higher, surpassing $92400.
If Bitcoin continues to recover, the rally may extend toward the 50-week exponential moving average at $99182.
The Relative Strength Index (RSI) on the weekly chart reads 40, indicating an upward trend and suggesting that bearish momentum is fading. To maintain the upward recovery, the RSI must move above the neutral level of 50.
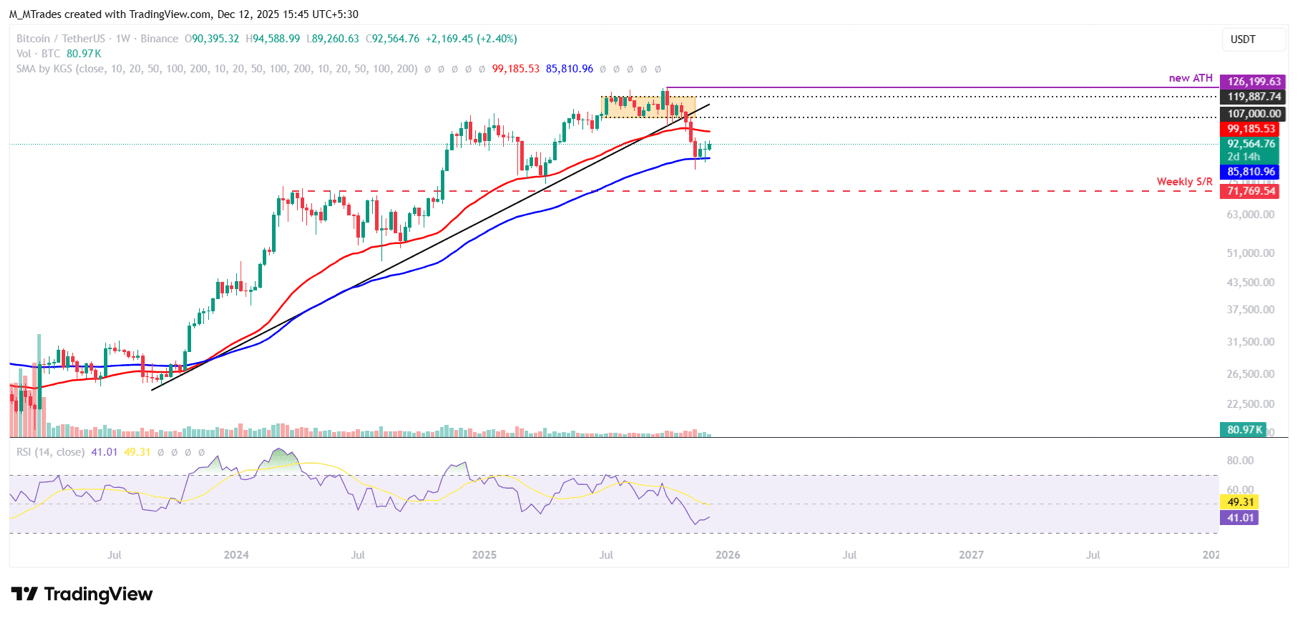
The weekly chart for the BTC/USDT pair.
On the daily chart, the price of $BTC was rejected at the 61.8% Fibonacci retracement level at $94253 (derived from the April low of $74508 to the all-time high of $126199 set in October) on Wednesday. However, on Thursday, Bitcoin bounced back after retesting the psychological level of $90000.
If Bitcoin can break above the downward trend line (derived from connecting several peaks since early October) and close above the resistance level of $94253, the rally may extend toward the psychological level of $100000.
The Relative Strength Index (RSI) on the daily chart is stable near the neutral level of 50, indicating no momentum in the near term on either side. To maintain upward momentum, the RSI must move above the neutral level. At the same time, the Moving Average Convergence Divergence (MACD) showed a bullish crossover at the end of November, which is still valid, supporting the bullish hypothesis.
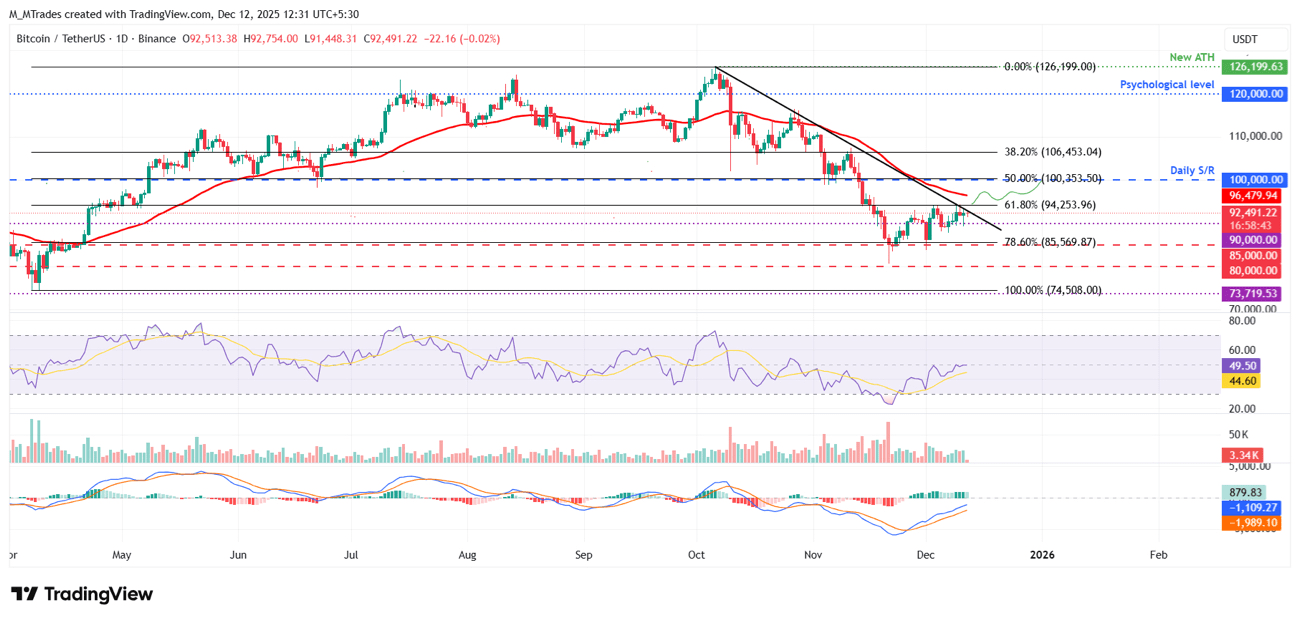
The daily chart for the BTC/USDT pair.
If Bitcoin resumes its downward correction, the first major support is at $85569, aligning with the 78.6% Fibonacci retracement level.
#BTC #BTC走势分析 #BinanceSquareBTC #BinanceSquareFamily #BinanceSquare
