Solana is currently in a consolidation phase, and while price action may look boring on the surface, these are often the moments before volatility returns.
📈 Bigger Picture: Markets Need to Breathe
After a strong decline from the September high into the November low, the market needs time to rebalance. This is completely normal behavior.
What we’re seeing now is a sideways consolidation, which can be interpreted as the market “breathing” after a directional move. On the weekly chart, Solana is currently holding a key support zone between $117 and $138.
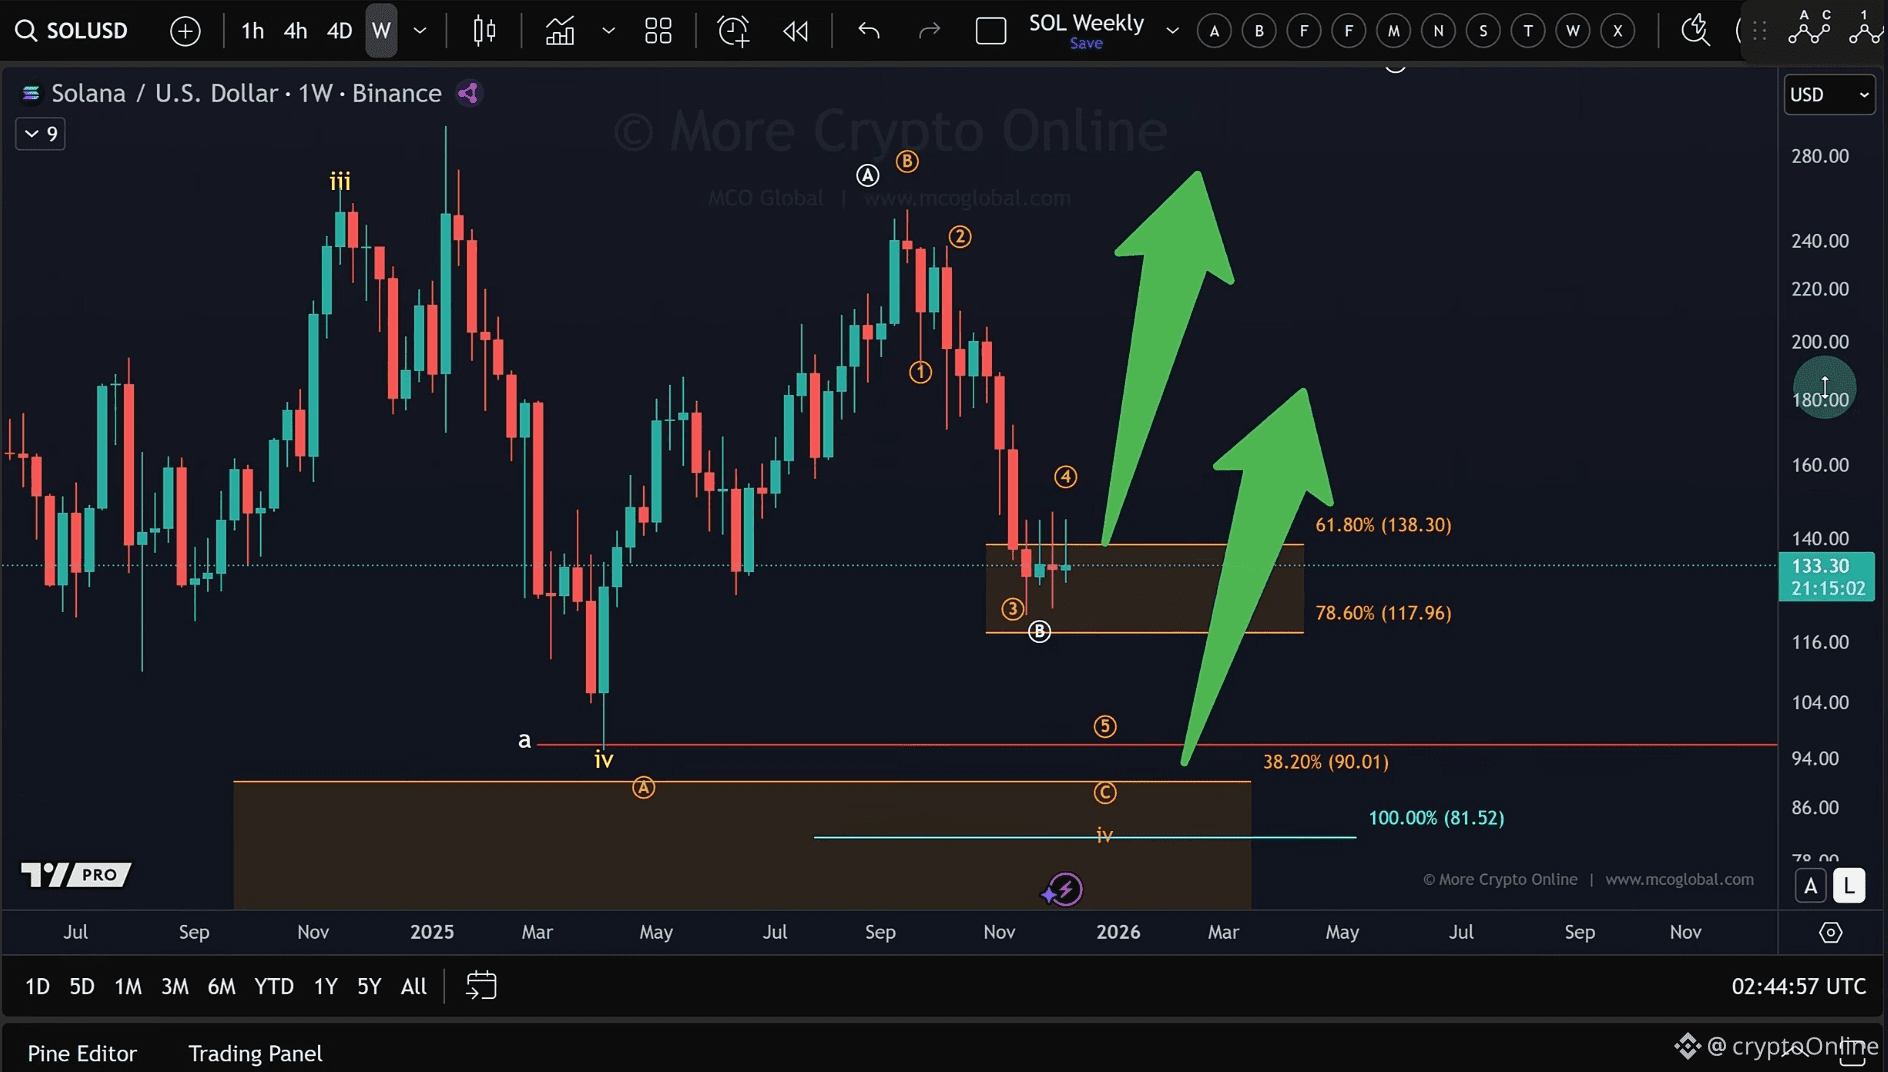
This sideways price action can be treated as part of a larger Wave 4 structure. While a move higher is technically possible, the more probable scenario remains one more low—a potential Wave 5 of C—as long as support continues to hold.
🔄 Medium-Term Structure: ABC Consolidation
Zooming in, Solana has now been moving sideways for about four weeks. This range can be interpreted as an ABC corrective structure, where:
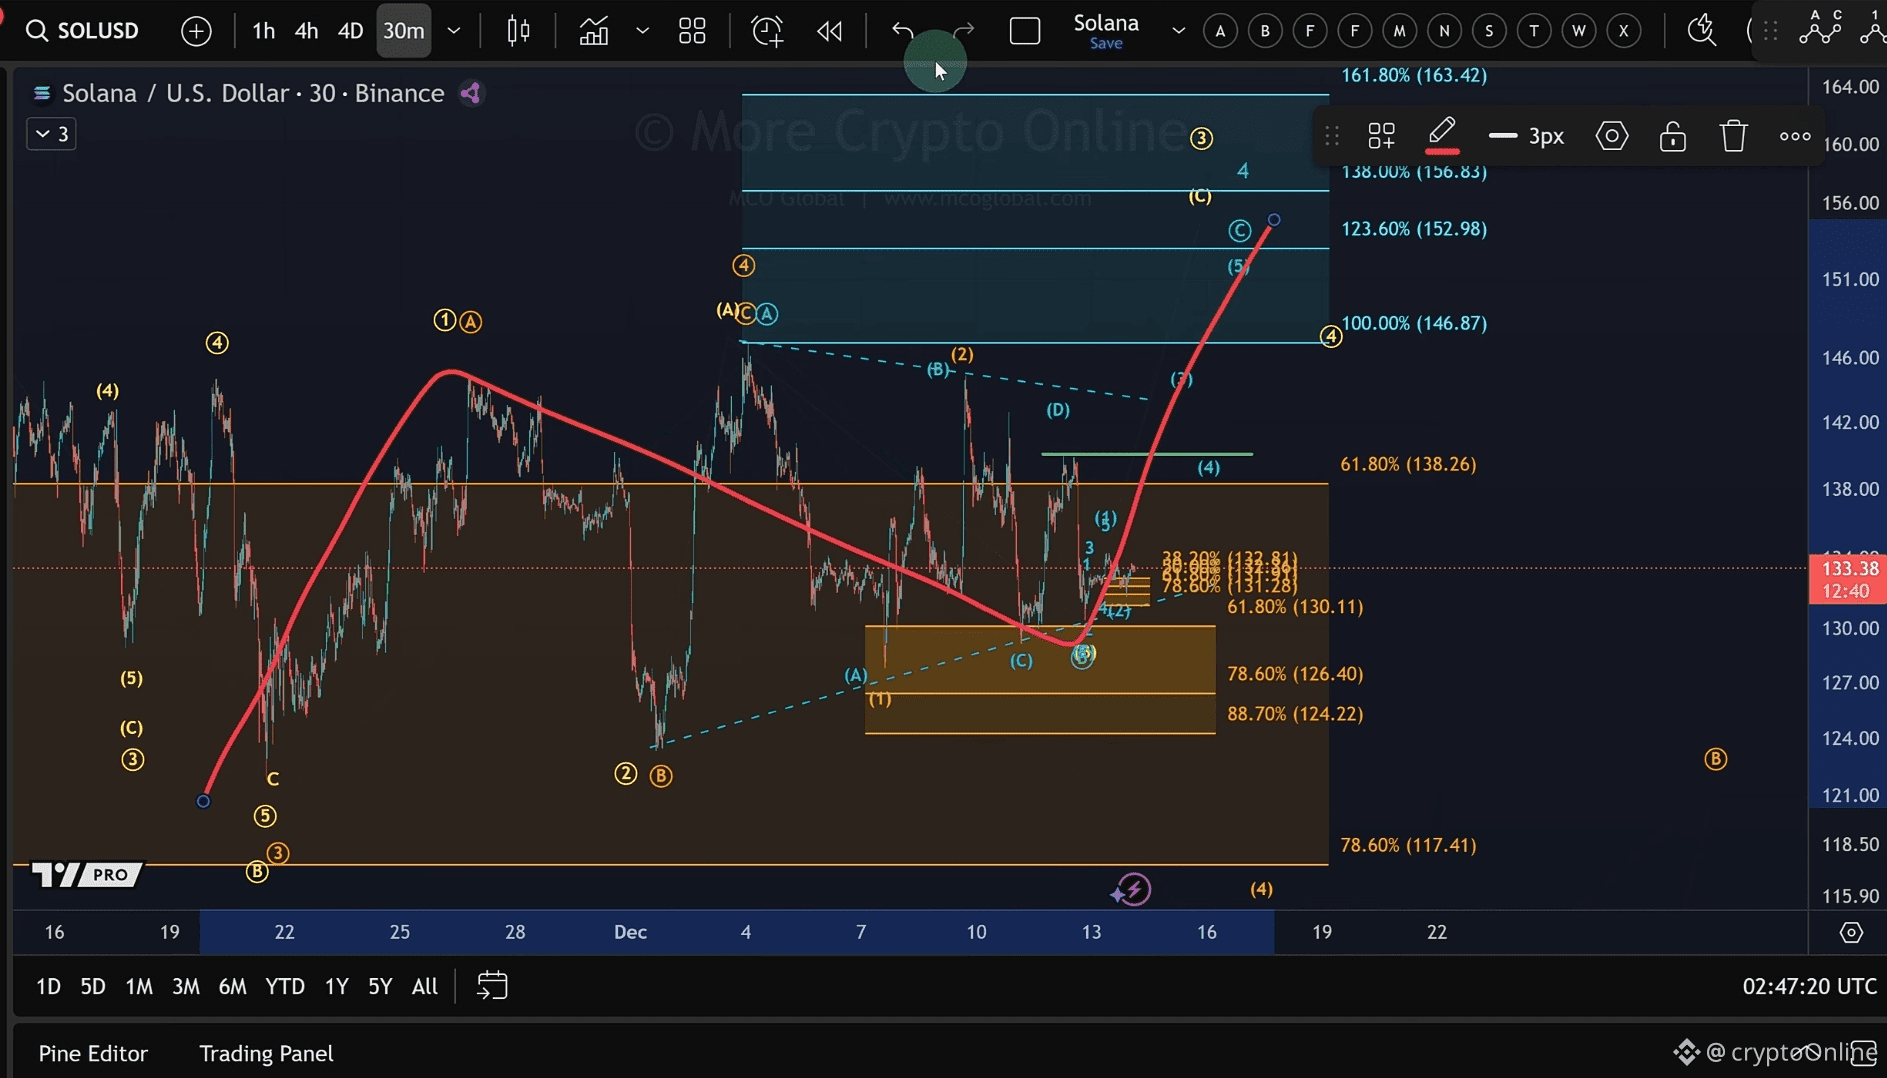
Wave A initiated the consolidation
Wave B is currently unfolding sideways
Wave C could still develop next
This sideways movement is best viewed as a B-wave, and B-waves are known to be fragile—they can easily shift or extend.
🧠 Short-Term View: Micro Structure & Key Levels
On the lower time frame, a micro five-wave move can be identified from the recent low. While it’s not a clean or strong structure, it does technically count as a five-wave sequence.
This should not be considered a high-confidence 1–2 setup, but it’s still useful for short-term context.
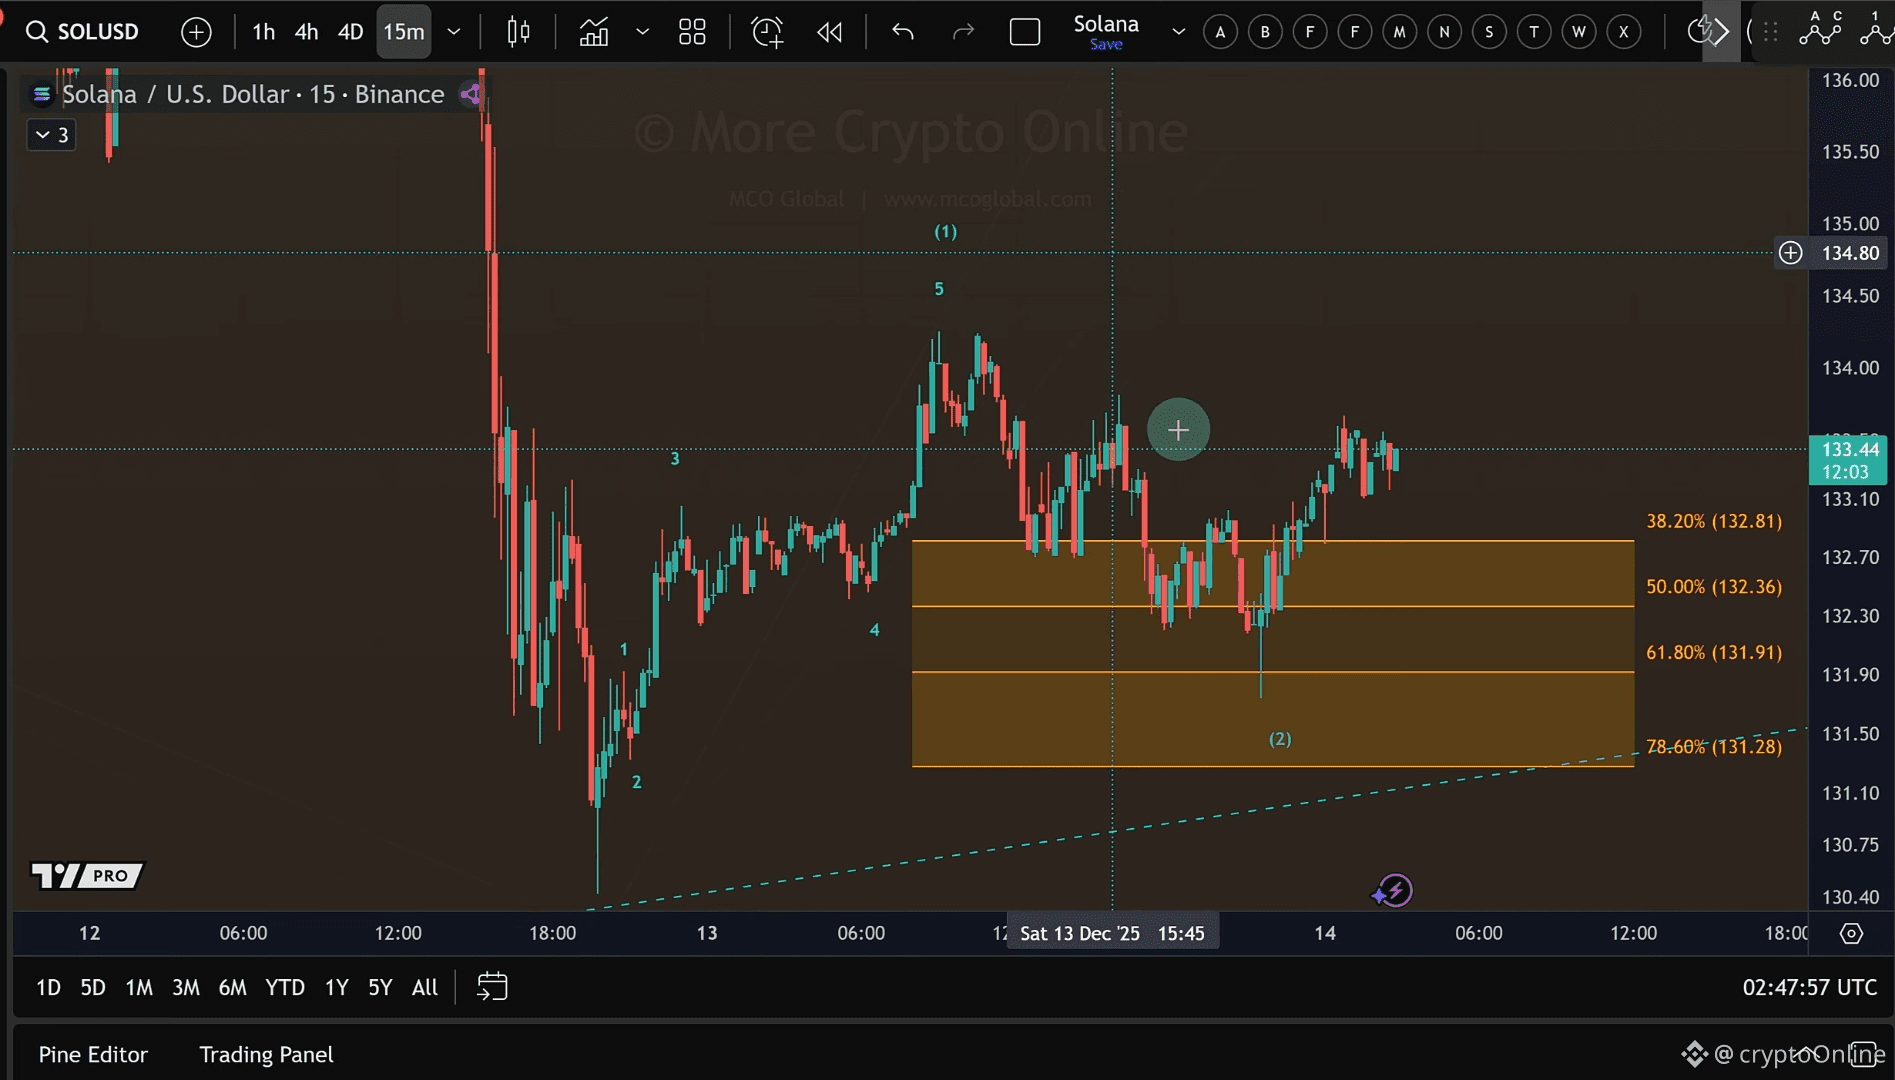
🔑 Key Levels to Watch:
Resistance: $134.25
A break above this level would confirm a short-term low.
Support: $131.28
A break below would suggest the B-wave is resetting lower.
The market remains quiet, but these transition phases often precede explosive moves.
