1. Overall Analysis and Judgment
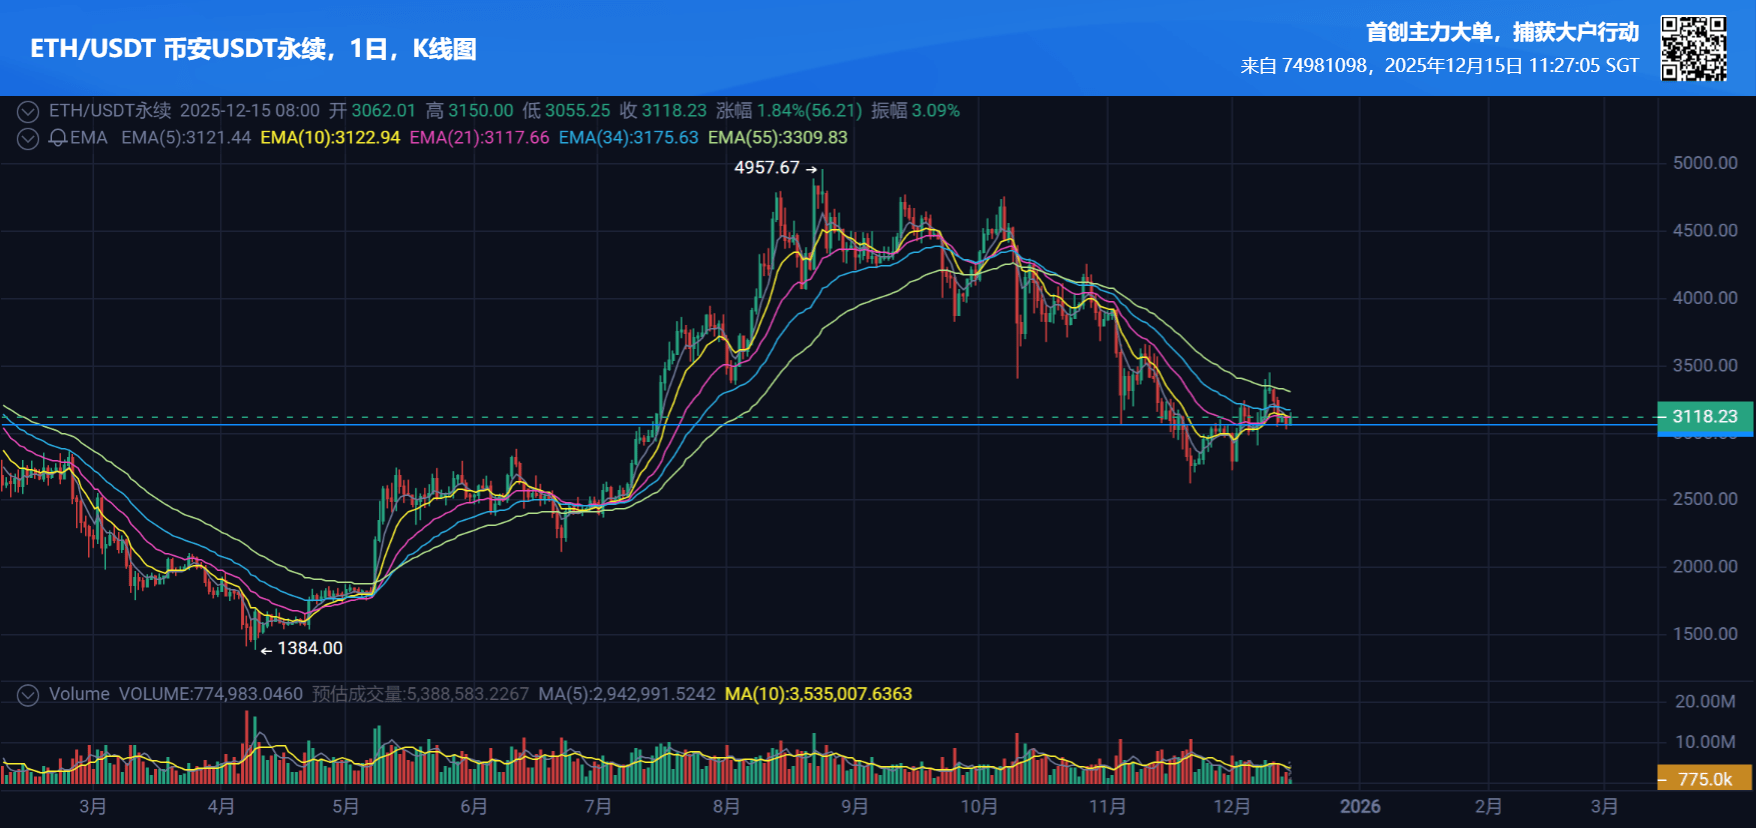
ETH is currently in a range-bound consolidation pattern, fluctuating between 1384 and 3921.9, lacking a clear directional trend in the short term. From a technical perspective, the moving average system shows a tangled state, with the short-term price above the short-term moving average but below the long-term moving average, making the trend signal unclear. At the same time, a bearish engulfing pattern has appeared in the candlestick formations, indicating that the market may face certain downward pressure. However, due to the strong support at 1384, the price is likely to remain within the range and continue to fluctuate in the short term.
In terms of the external environment, market sentiment is neutral, macroeconomic pressures are limited, and there are no major event risks recently. On the news front, robust consumption and employment data, along with institutions increasing their positions in crypto assets, are positive factors, while concentrated liquidity risks and leveraged losses are negative factors, intertwining to have a limited overall impact on the market. Therefore, ETH is more likely to continue its range-bound consolidation in the short term, requiring close attention to the breakout situation of key support and resistance levels.
II. Key evidence interpretation
Technical diagnosis
Market state identification: The current market is identified as 'range-bound'.
Key findings:
The candlestick pattern has shown a bearish engulfing formation, indicating that the market may face downward pressure.
The current price is between the support level of 1384 and the resistance level of 3921.9, with moving averages entangled, indicating that the market is in a range-bound oscillation.
Conflicting moving average signals: Short-term prices are above the short-term moving average but below the long-term moving average, with the short-term moving average flat and the long-term moving average downward, making the trend signal unclear.
Market volatility is high, but sentiment is neutral, and transaction volume data is missing, making it impossible to confirm the relationship between volume and price.
Macroeconomic and sentiment diagnosis
Overall environment rating: The external environment is rated as 'neutral'.
Core evidence:
The Fear & Greed Index shows market sentiment as neutral, with no significant panic or greed evident.
Macroeconomic pressure is limited, with missing data on the dollar index and government bond yields, which have not significantly impacted the market.
News is mixed, with strong consumer and employment data, institutional investments in crypto assets, and liquidity concentration risks, as well as leveraged losses, coexisting, which limits their impact on the market.
III. Strategy recommendations and key levels
Based on the above analysis, the following trading strategy plan is proposed; please refer to your own risk preference.
Entry area: 3900 USDT
Stop-loss price: 3950 USDT
Target area: 3120 USDT
Strategy basis: Given that the current market is in a range-bound state, prices are near the strong resistance level of 3921.9, and the candlestick pattern has shown a bearish engulfing signal, indicating that the market may face downward pressure. Therefore, adopting a high short strategy near the resistance level is a reasonable choice in line with the current oscillating pattern.
Strategy failure scenario: If the price breaks above 3950 and stabilizes, it indicates that the resistance level has failed, and timely stop-loss is required.
