Alright team, let's break down this juicy $DOT chart and see what the long-term trend is whispering to us. This 1W chart paints a sobering, yet clear, picture for Polkadot, emphasizing the necessity of patience.
Technical Analysis
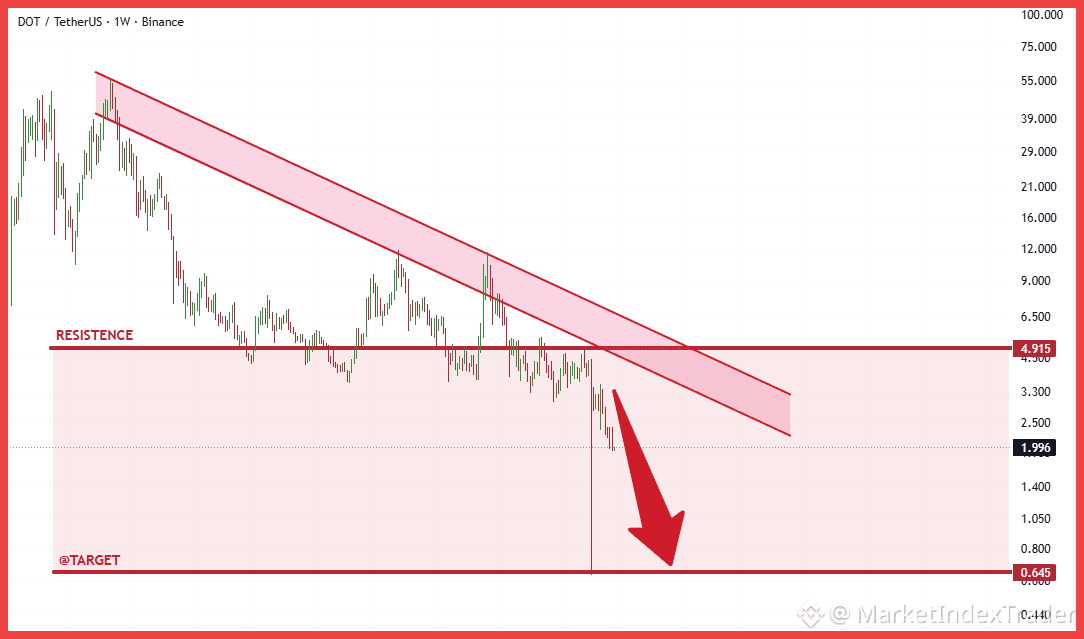
The technical analysis confirms $DOT is trapped within a major, multi-year descending channel. Currently trading near $1.996, the price failed decisively to hold the key structural resistance level at $4.915. The chart clearly anticipates a strong continuation of the bearish momentum following the failure to break the channel ceiling. If the current trend holds, the immediate and likely downside target is the crucial psychological and structural support zone at $0.645.
Fundamental View
On the fundamental side, Polkadot remains one of the most innovative ecosystems. The ongoing progress toward Polkadot 2.0, focusing on "Agile Coretime," promises to revolutionize its parachain structure, leading to greater efficiency and flexibility for developers. This core infrastructure development suggests strong long-term value, even if the current market structure is extremely weak.
Strategy
While the fundamentals are strong for the future, the chart dictates caution for traders. I am waiting patiently for a definitive entry around the $0.645 target zone for maximum long-term accumulation, or confirmation of a decisive breakout above the descending channel.
Highly recommend HOLD and Stacking $DOT at Binance
Feel free to comment the altcoin you are holding and we will check it for you!
#DOT #Polkadot #TechnicalAnalysis #Crypto #BinanceSquare #Altcoins #Bitcoin

