The analysis of Cara from Steady Lads highlights this week the current complexity of the market, torn between several contradictory graphical figures. These structures, well known in technical analysis – the ascending wedge, the Bear Flag, and the ascending triangle – are absolutely essential for deciphering investor indecision after the Fed announcements. It is the interweaving of these signals on the global indices that justifies the absence of a clear direction and the strategic caution adopted by our in-house trader.
The key points of this article:
The analysis by Cara de Steady Lads highlighted the complexity of the current market, with contradictory graphic figures making the situation uncertain.
Ethereum has distinguished itself by technical clarity, contrasting with the uncertainty of the global market and Bitcoin, which has drawn particular attention from the analyst.
Steady Lads highlights contradictory figures in the global market.
The study of the global market ($TOTAL) reveals a tension between diametrically opposed scenarios. On one side, Cara identifies the possibility of a Bear Flag, which represents a continuation figure. It appears after a sharp decline, consisting of a short phase of consolidation or slight upward correction.
For the analyst, this flag indicates that the observed pause could be temporary and the initial bearish trend is most likely to resume.
On the other side, the possibility of an ascending triangle proposes a hopeful scenario. This bullish continuation figure is defined by a constant horizontal resistance line and a support line that is clearly ascending. The rising support shows that buyers are becoming more impatient and reacting to increasingly higher price levels.
Historically, the ascending triangle most often resolves with a break of the horizontal resistance from above, marking the vigorous resumption of the bullish trend. This coexistence of scenarios is the main source of the indecision observed on the index $TOTAL.
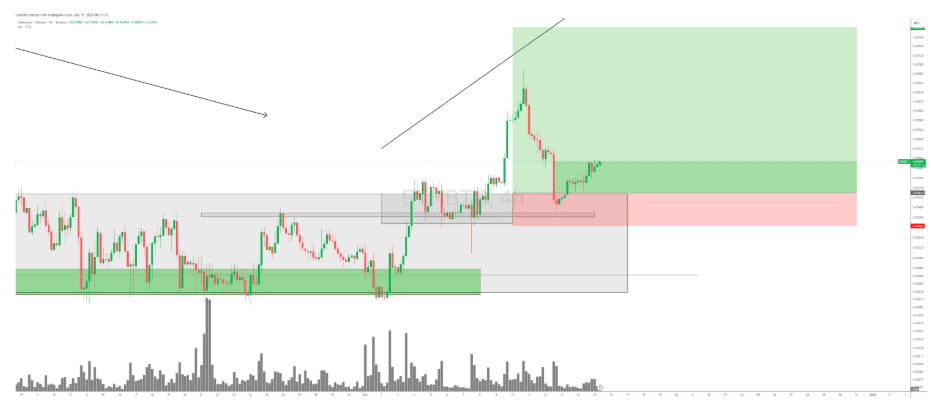 For Cara, only Ethereum shows clear signs of recovery – Source: Steady Lads weekly analysis.
Bitcoin and Ethereum: Between uncertainty and technical clarity
On Bitcoin ($BTC), the structure tends to reinforce a cautious bias. The Daily chart presents an ascending wedge, which is a figure indicating the exhaustion of the rise. It is characterized by rising trend lines that narrow, meaning that buyers are increasingly struggling to push prices to new highs.
This configuration is statistically considered a bearish reversal figure and justifies the difficulty of BTC to move away from its key support located between $86,500 and $87,000. Consequently, the asset remains in a phase of consolidation and uncertainty.
In contrast, Ethereum ($ETH) stands out with welcome technical clarity. Cara observes the validation of a breakout on the ETH/BTC pair, which reflects the relative strength of Ether compared to its elder. While BTC stagnates in ambiguous figures, ETH has managed to break a major consolidation and has performed a clean retest of the key level.
This univocal technical action on Ether contrasts sharply with the indecision of the global market and Bitcoin, making Ethereum the only asset that Cara chooses to expose himself to.
Technical analysis reveals the state of confusion in the market: the figures observed in the global market and Bitcoin contradict each other or signal a bullish exhaustion. This graphic confrontation, combined with multiple price failures to break through major resistance, confirms the state of total uncertainty. This situation fully justifies Cara de Steady Lads' defensive approach, which maintains a significant cash exposure and focuses exclusively on the asset demonstrating a clear direction and proven relative strength: Ethereum.


