

Ondo's price continues to correct on Tuesday after falling by about 6% the previous day.
Ondo Finance announced plans to integrate with Solana in early 2026 to expand its platform for tokenized stocks and ETFs.
Technical indicators remain bearish, with open interest declining, indicating reduced trader participation.
The price of Ondo ($ONDO ) continues to correct, trading below $0.40 at the time of writing this report on Tuesday after a 6% drop the previous day. Ondo Finance announced on Monday that it plans to integrate with Solana (SOL) in early 2026 to expand its platform for tokenized stocks and ETFs, highlighting a long-term bullish outlook. However, short-term price action and derivatives indicate further declines, supported by weak momentum and waning trader conviction.

Ondo is looking to expand with integration with Solana
Ondo Finance announced on its X account on Monday that it plans to integrate with Solana in early 2026, bringing its leading platform for tokenized stocks and ETFs to the network.
These developments indicate a bullish outlook for the original Ondo token, $ONDO , as integration enhances scalability and liquidity and benefits from the rapidly growing SOL user base, expanding the Ondo ecosystem and adoption. Despite this positive news, the price of Ondo dropped by about 6% on Monday.

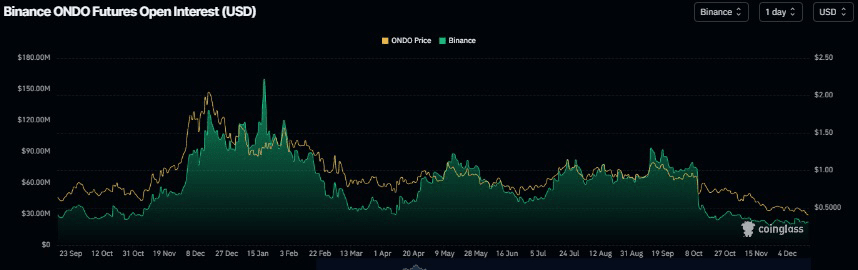
The short-term bearish price action also supports the decline in ONDO's open interest on the Binance exchange, which currently stands at $22.32 million on Tuesday, near its annual low. This decline in open interest suggests that traders are closing their positions and speculative interest is waning, rather than entering new buy orders.
Price predictions for Ondo: ONDO bears are in control of the momentum
The price $ONDO was rejected at a Fibonacci retracement level of 38.20% at $0.52 (from a high of $0.97 on October 6 to a low of $0.24 on October 10) on December 10 and has fallen by more than 16% as of Monday. As of Tuesday, ONDO continues to trade around $0.40.
If ONDO continues in its downward trend, the decline may extend towards the low of October 10 at $0.24.
The Relative Strength Index (RSI) on the daily chart is at 30, indicating a trend toward oversold conditions, reflecting strong bearish momentum. Additionally, the Moving Average Convergence Divergence (MACD) shows a bearish crossover on Tuesday, supporting the negative outlook.
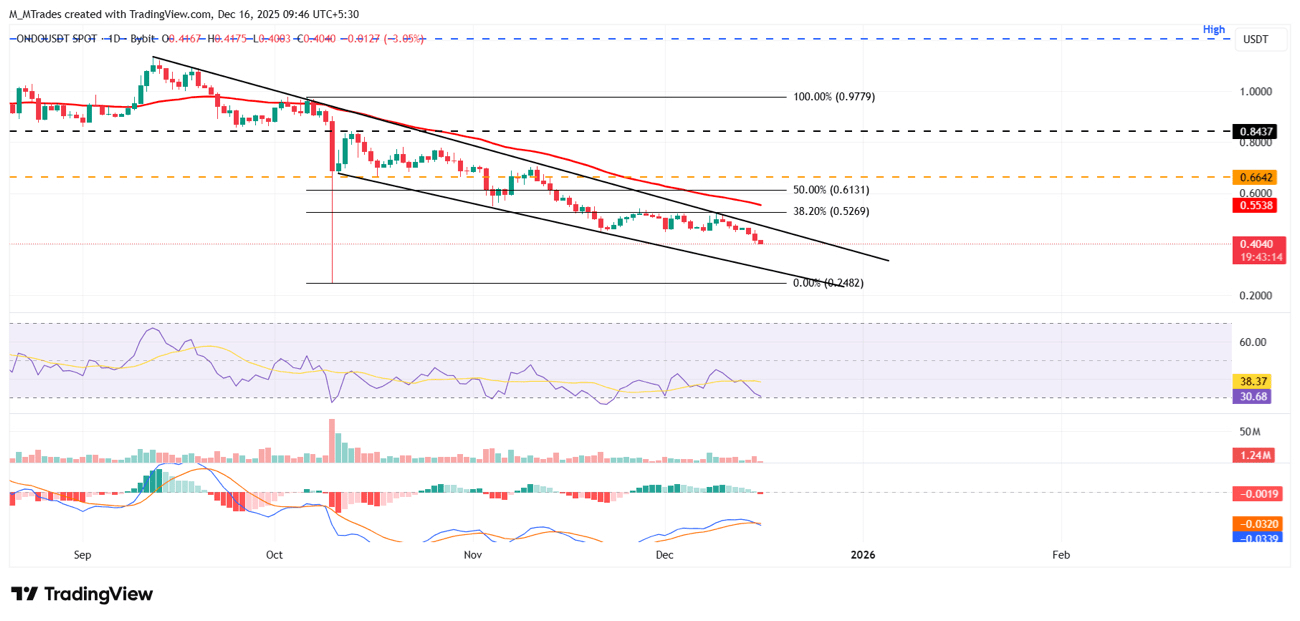
Daily chart for the ONDO/USDT pair
However, if ONDO recovers, the rebound may extend towards a Fibonacci retracement level of 38.20% at $0.52.