

Altcoins mirror 2017 setups, signaling possible explosive growth after current consolidation and volatility zones.
Accumulation phases at market bottoms highlight key opportunities for strategic entry points in altcoin trading.
Technical indicators like weekly EMA90 and StockTKD below 20 suggest rare reversal points and potential market bottoms.
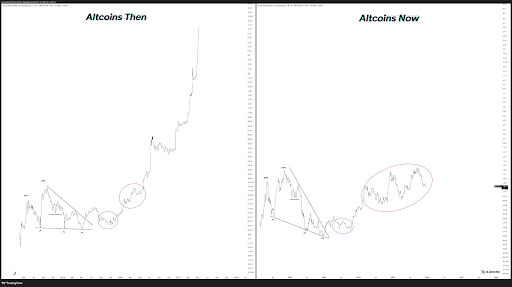
The altcoin market is signaling patterns reminiscent of 2017, raising anticipation among investors. According to Javon Marks, altcoins currently resemble the setup just before their massive 2017 surge.
He notes, “The year coming could take us into yet another new level of high power growth for the market. This may only be the calm before.” The historical comparison reveals crucial insights into accumulation, volatility, and potential breakout phases, providing traders with actionable context.
 Source: Javon Marks
Looking at both past and current charts, the altcoin market moves in cycles. Back in 2017-2018, altcoins jumped from a $10 billion market value to more than $10 trillion. The chart shows a blue circle where prices stabilized before the big rally and a red circle where the market became very volatile before dropping.
Investors rotated between cryptocurrencies during these phases, driving both rapid gains and sharp corrections. This cycle emphasized accumulation and distribution zones as essential precursors to major price movements.
Current Cycle Mirrors Historical Trends
From 2022 to 2025, the altcoin market has shown patterns similar to past cycles. After peaking in early 2021, altcoin prices dropped steadily throughout 2022. By late 2022, the market hit its lowest point and entered a phase of steady consolidation, shown as a blue circle on charts. Since 2023, prices have been gradually climbing, though they haven’t yet returned to their previous highs.
Javon Marks highlights, “Prices have recovered substantially from the 2022 bottom but remain below previous highs.” Black trendlines trace key pivot points, showing clear recovery and ongoing price discovery.
Moustache adds technical nuance by highlighting rare reversal indicators. He observes that when the total market cap touches the weekly EMA90, especially with StockTKD below 20, it usually marks market bottoms.
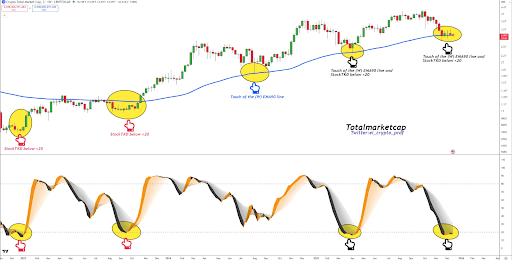 Source: Moustache
According to his chart comparison, altcoins have risen to over $1.2 trillion in recent months before falling back to about $900 billion. Thus, statistics from the past and present indicate that volatility is still high, but accumulation zones may pave the way for another big surge.
The post Altcoin Market Shows Historic Patterns Ahead of Potential Surge appears on Crypto Front News. Visit our website to read more interesting articles about cryptocurrency, blockchain technology, and digital assets.