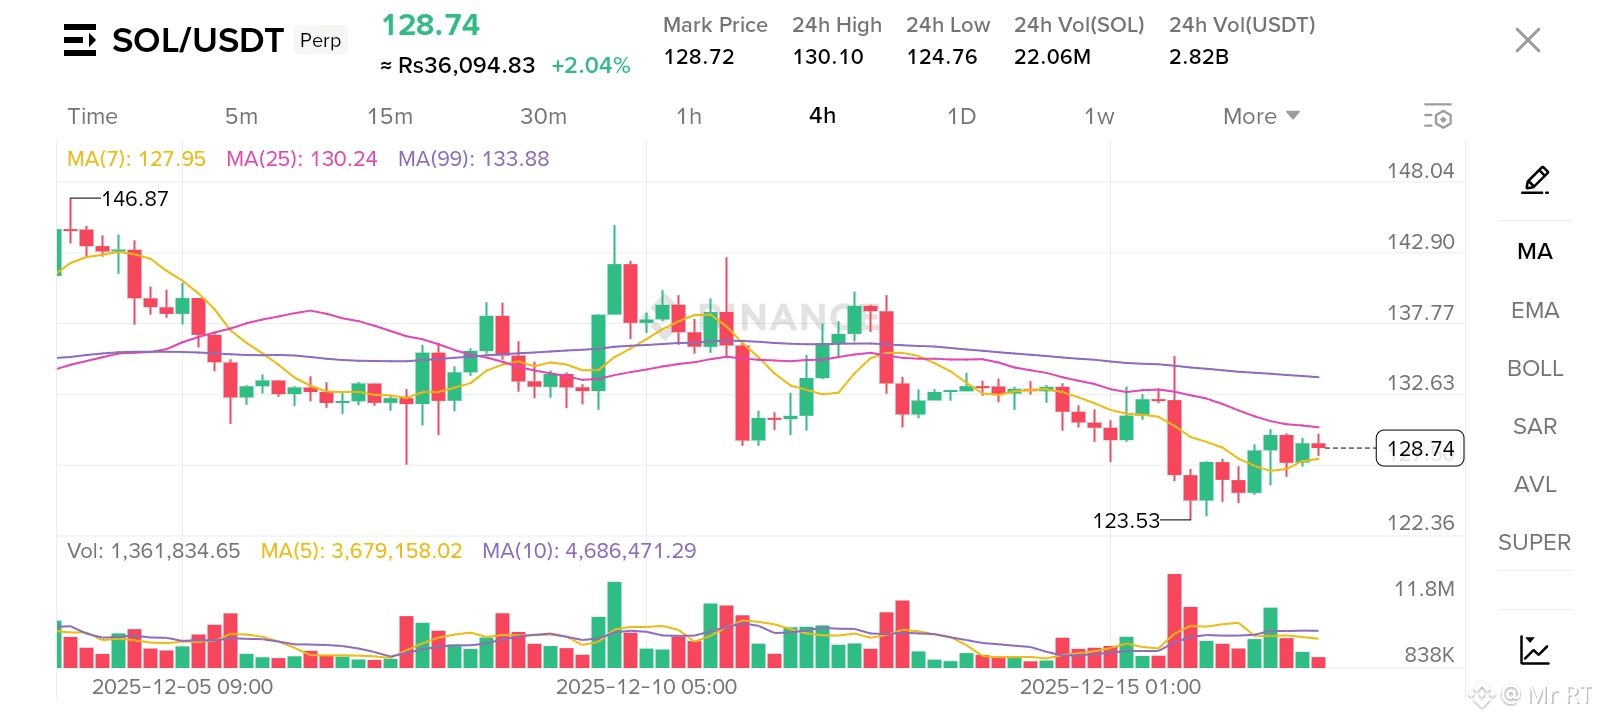
📈 Technical Analysis of $SOL /USDT (4H Chart)
1. Trend and Price Action
* Overall Trend: The trend over the past week has been Sideways/Consolidating with a slightly bearish bias. The price established a high near $146.87 and has since been making lower highs and lower lows, culminating in a recent low of $123.53.
* Recent Price Action: The price has bounced off the $123.53 low and is currently trading around $128.74. This is an attempt at a short-term recovery.
* Key Levels:
* Immediate Support: $123.53 (The recent swing low).
* Immediate Resistance: The cluster of moving averages near $130.00 - $130.24.
2. Moving Averages (MAs) Analysis
The chart displays three Simple Moving Averages (SMAs):
* MA(7) - Yellow: 127.95
* MA(25) - Red: 130.24
* MA(99) - Purple: 133.88
| Indicator | Observation | Interpretation |
|---|---|---|
| MA Alignment | MA(7) < MA(25) < MA(99) | A Strong Bearish Signal. This sequence confirms that the momentum is still downwards on this timeframe. |
| Current Price vs. MAs | The current price (128.74) is above the MA(7) (127.95) but is below both the MA(25) (130.24) and MA(99) (133.88). | The price is attempting to recover but is meeting strong overhead resistance defined by the mid-term (MA(25)) and long-term (MA(99)) averages. |
| MA(7) Crossover | The MA(7) is currently pointing slightly up, suggesting a minor momentum shift, but is still below the MA(25). | No confirmed bullish trend change. The MA(25) at 130.24 is the crucial resistance zone. |
3. Volume Analysis
* Downtrend Volume: The sharp drop leading to the $123.53 low (around Dec 15th) was accompanied by a noticeable spike in selling volume (large red bar). This confirms the move was aggressive.
* Recovery Volume: The volume during the current bounce (green bars) is relatively average and does not show the kind of overwhelming buying pressure needed to confirm a strong reversal.
🔮 Next Move Prediction
Based on the technical structure, the primary trend remains bearish, but the recent bounce suggests a short-term fight by the buyers.
Bearish Scenario (Most Likely)
The established MA alignment (Bearish Order) and the price being trapped below the key moving averages suggest that overhead selling pressure will likely prevail.
* Key Resistance Test: The price is highly likely to test the MA(25) at $130.24.
* Prediction: A rejection at the $130.24 level, followed by a close below the current price, would be a strong signal for a continuation of the downtrend.
* Target: A confirmed rejection would likely lead to a re-test of the $123.53 support. A break below this level would open up further downside.
Bullish Scenario (Breakout and Reversal)
For the bullish scenario to take hold, buyers must prove they can sustain momentum against the overhead resistance.
* Confirmation: The price must close decisively above the MA(25) at $130.24 on the 4H chart. This would signal a shift in short-term momentum.
* Next Target: A confirmed break would then target the longer-term MA(99) at $133.88, which, if broken, would signal a stronger recovery toward the $137.77 region.
Conclusion and Trading Strategy
The market is at a critical inflection point. The path of least resistance is still downwards due to the bearish moving average structure.
* Wait for Confirmation: Wait to see how the price reacts to the $130.24 (MA(25)) resistance level.
* Bias: Slightly Bearish. A close above $130.24 would negate the bearish bias and switch the focus to a recovery.