🐸 $PEPE /USDT (4-hour chart) Technical Analysis
1. Trend and Price Action
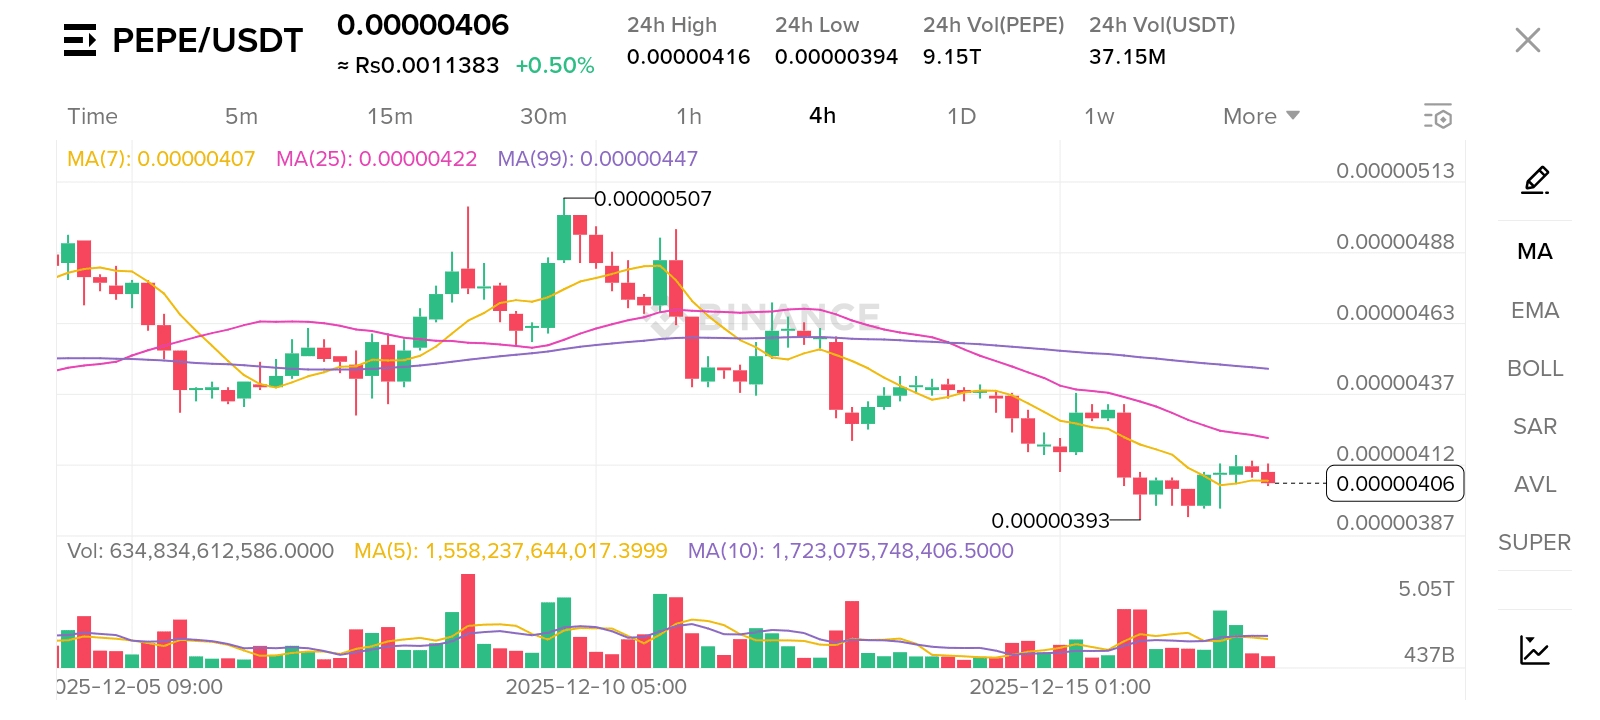
* Overall Trend: The trend is clearly bearish. The price has been declining since reaching a high of 0.00000507 on December 10, consistently making lower highs and lower lows.
Recent Price Action: The price touched a recent low of *0.00000393 and is currently consolidating in a very narrow range around 0.00000406.
* Key Price Levels:
* Immediate Support Level: 0.00000393 (recent swing low).
* Immediate Resistance Level: 0.00000412 (99-period moving average).
2. Moving Average (MAs) Analysis
The chart shows three simple moving averages (SMAs):
* MA(7) - Yellow: 0.00000407
* MA(25) - Red: 0.00000422
* MA(99) - Purple: 0.00000447
| Indicator | Observation | Interpretation |
|---|---|---|
| MA Arrangement | \text{MA(7)} < \text{MA(25)} < \text{MA(99)} | A classic strong bearish signal. The short-term average is below the mid-term, and the mid-term is below the long-term. This confirms a strong downward trend has been established. |
| Current Price vs MA | Current Price (0.00000406) is caught between MA(7) and recent lows. It is significantly below MA(25) and MA(99). | \text{MA(25)} (0.00000422) and \text{MA(99)} (0.00000447) both act as strong dynamic resistance. Bears (sellers) still dominate. |
| MA Cross | The distance between moving averages is large and sloping downward. | A bullish cross (golden cross) is not imminent. Momentum still severely leans towards downward. |
3. Volume Analysis
* Downtrend Volume: The significant selling volume (large red bars) accompanying the drop from the high (December 10) confirmed the bearish sentiment.
* Consolidation Volume: The current consolidation phase (December 15-17) shows low and decreasing volume. This indicates a lack of sufficient buying interest to push prices higher, suggesting that the current price action is likely just a pause before the next directional move.
🔮 Next Step Trend Prediction
The technical structure of PEPE/USDT shows an overwhelming bearish tendency. The current narrow consolidation is most likely a bear flag pattern or distribution phase, followed by the next wave of decline.
Bearish Scenario (Most Likely)
The established trend and completely bearish MA arrangement suggest that recent lows are likely to be re-tested soon.
* Prediction: The most likely next step is to break below the immediate support level.
Target 1 (Break Confirmation): A decisive close below *$0.00000393** support level on the 4-hour chart.
Target 2 (Continued Decline): Once support is broken, the next reasonable target area based on price extension will be around *$0.00000375 to $0.00000360**.
Bullish Scenario (Less Likely)
Bullish momentum requires significant, high-volume capital injection to overcome major resistance.
Confirmation: Price must decisively break and close above *MA(25) 0.00000422**.
* Next Target: If confirmed, this would indicate a short-term rebound, with the next target being MA(99) 0.00000447.
Conclusion and Trading Strategy
The market tendency is strongly bearish. The PEPE/USDT chart shows low-volume consolidation following a sharp decline, which typically develops in the direction of the potential trend. Traders should look for short opportunities when prices break below **$0.00000393 support level**.