
Currently, based on the chart USDT.D / (M1 + M2), you can observe the amount of money standing outside (stablecoin) compared to the amount of money in the system.
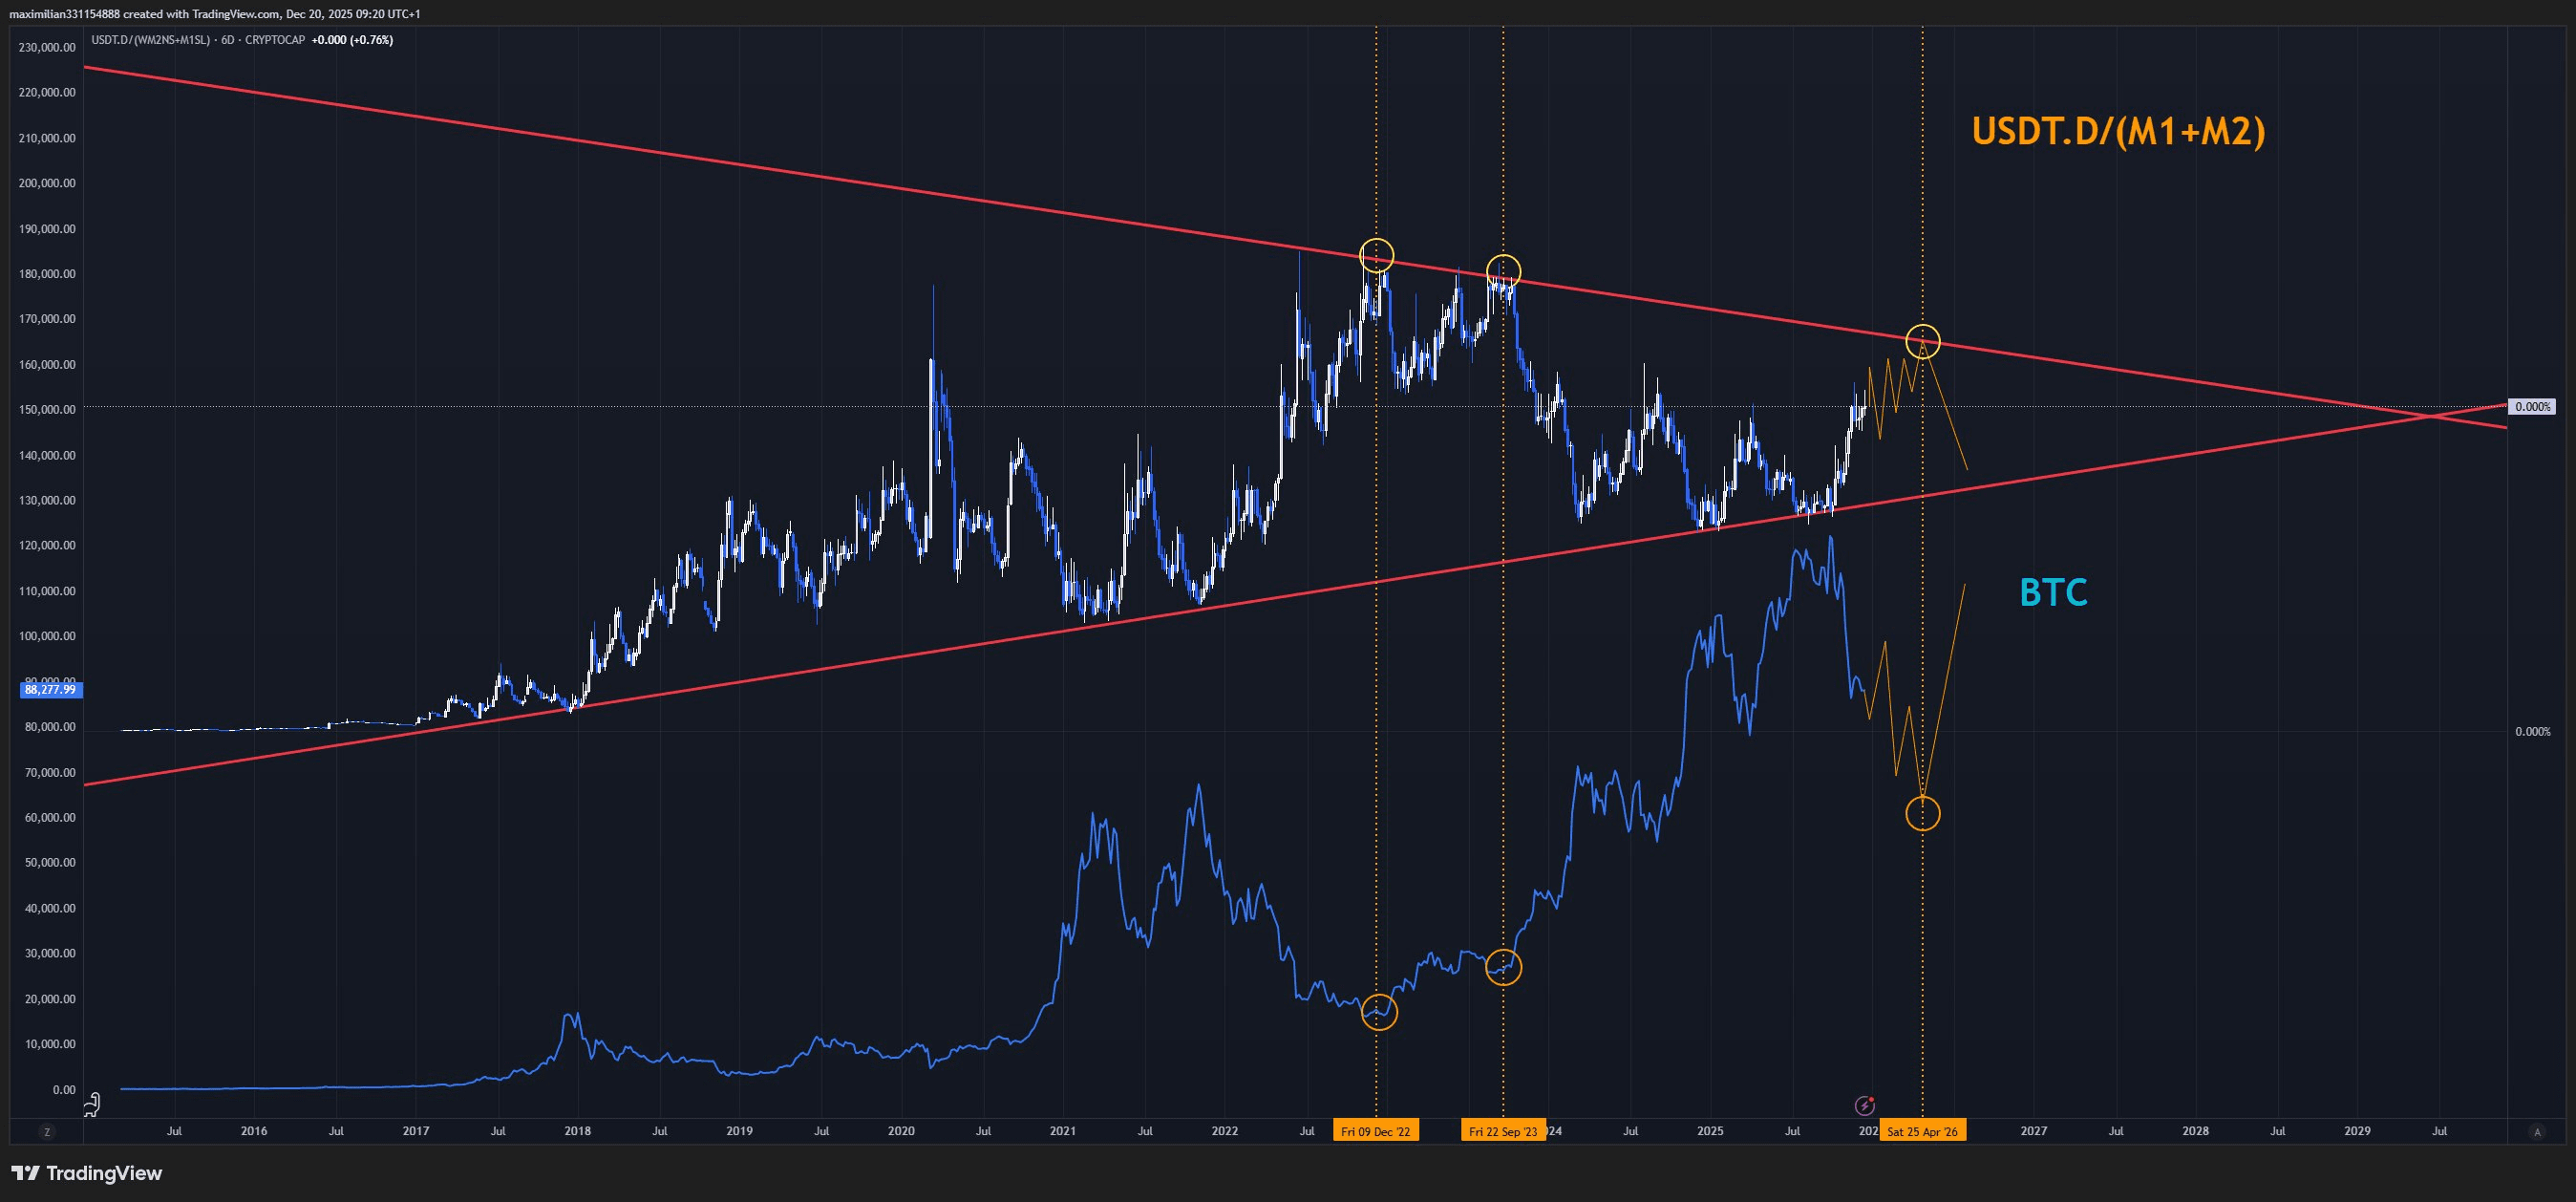
History shows that each time this index touches the upper edge of the large 'wedge', the market often creates a bear cycle bottom. Currently, the structure is still moving within that wedge, so I lean towards the scenario that the market's decline will continue, the market will still fluctuate, and sweep bottoms similar to the annoying sideways phase of 2024 $BTC

I remind you in advance not to be too surprised if you see prices continuously going up and down, making many people discouraged.
Next, you guys can follow the IBIT + Coinbase + MSTR chart compared to BTC. This shows that the 'proxy Bitcoin' cash flow in the traditional market is weakening and has just lost the long-term support trendline. In previous cycles, when this group broke down first, BTC usually went down afterward, rarely the other way around.
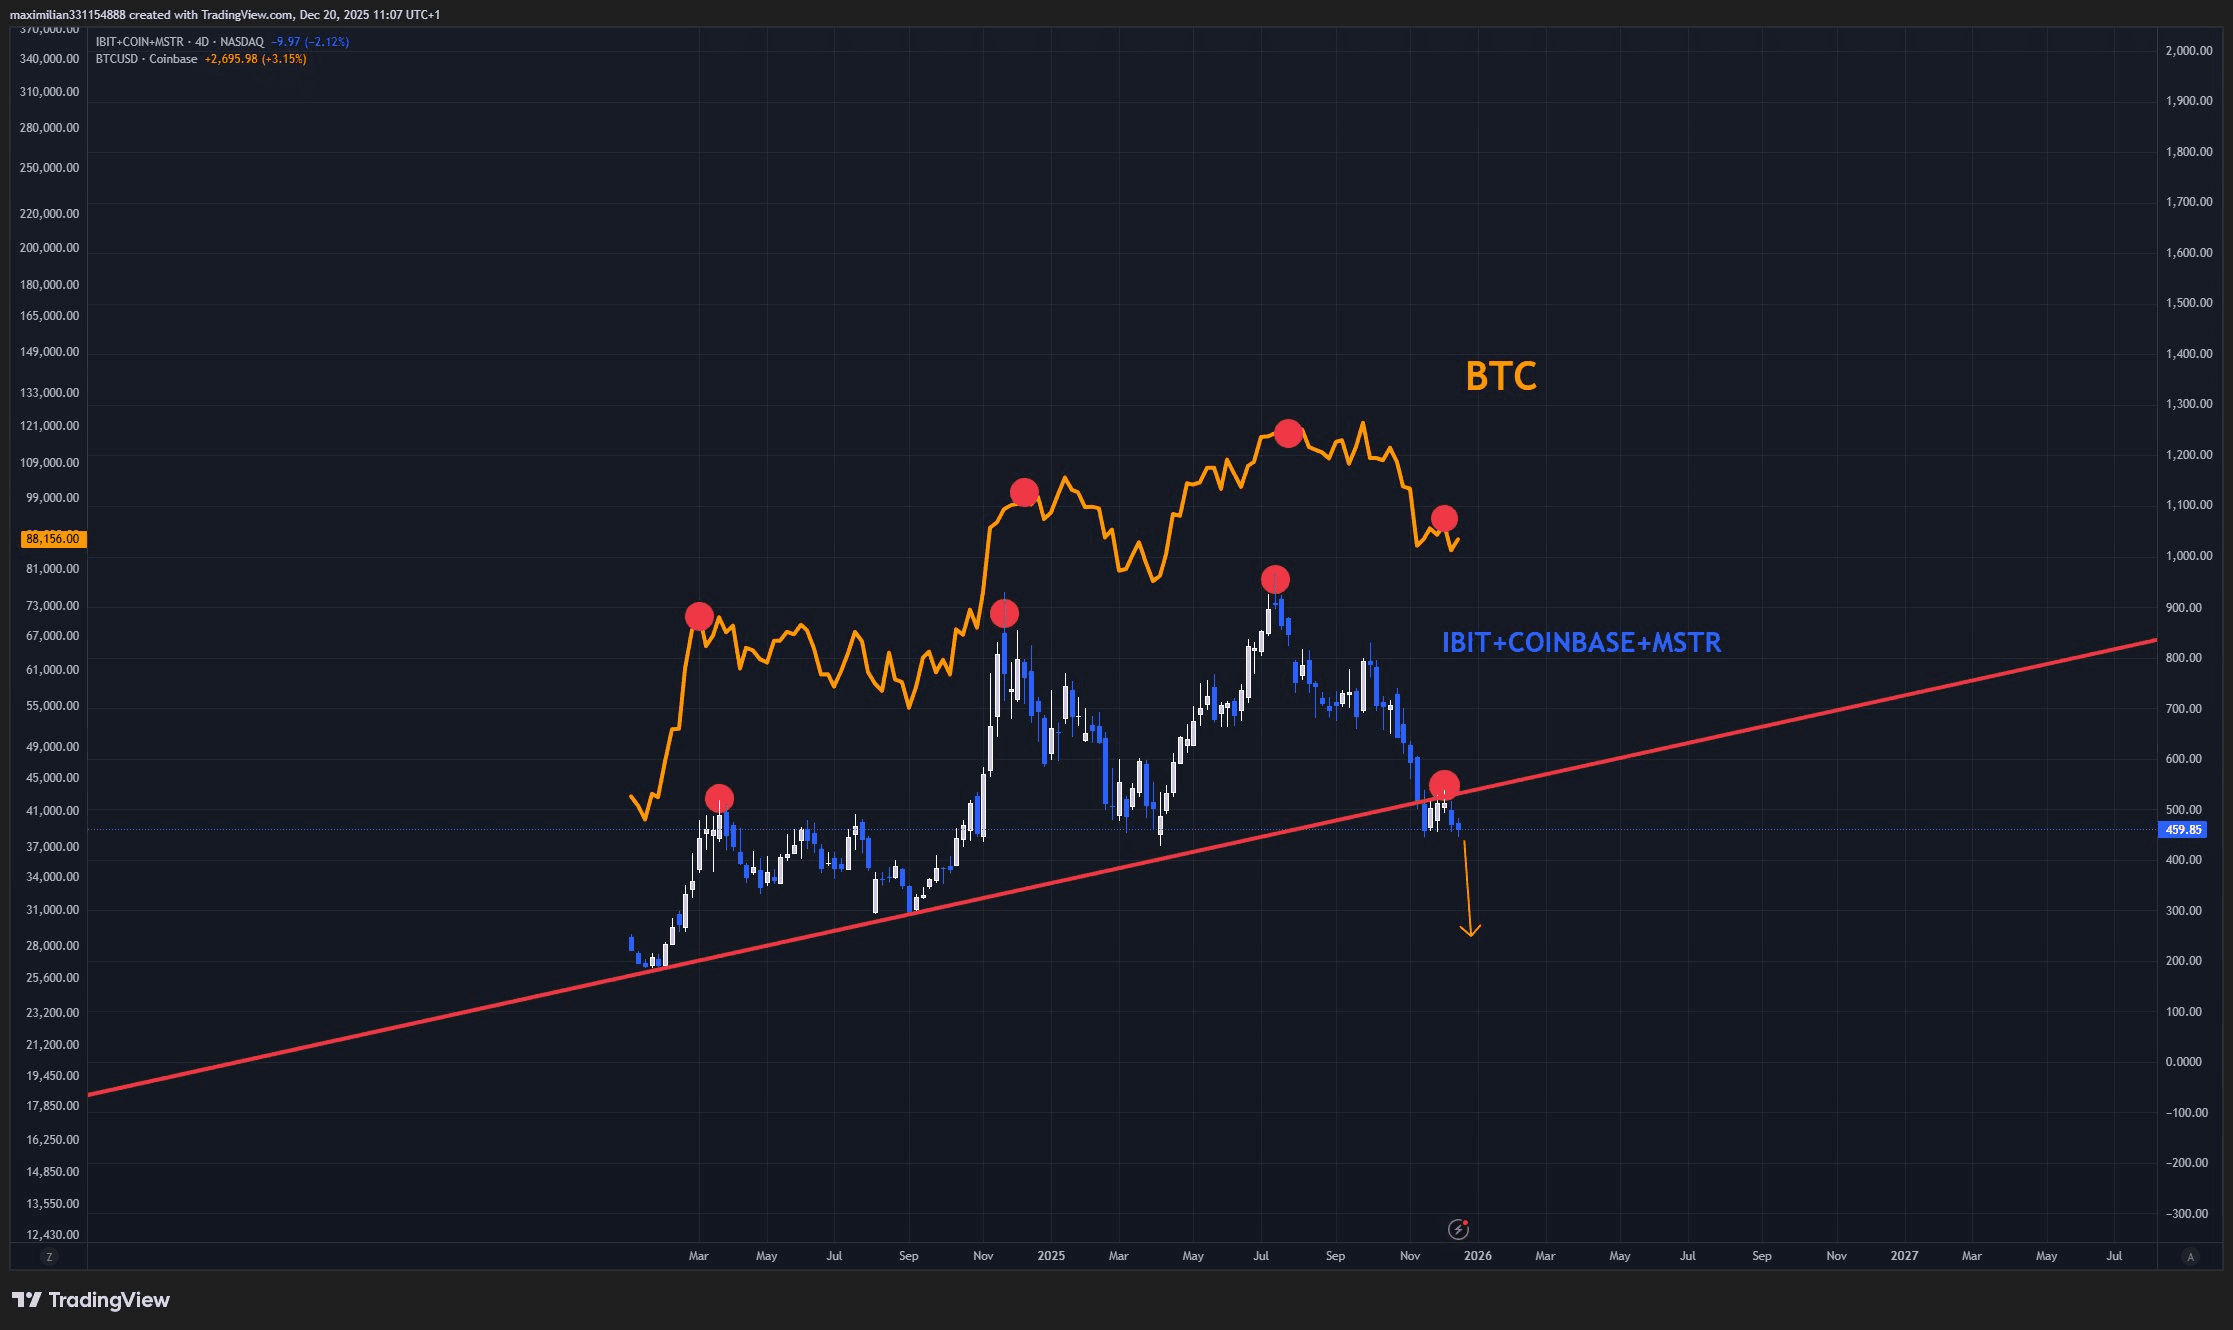
Short term: The market is still prone to being pushed down, strong fluctuations, it's not the time to be too excited.
Medium term: this resembles a shorter bear market rather than a complete cycle collapse, and it could end when USDT.D/(M1+M2) touches the upper resistance area of the wedge.
You guys should prepare mentally for the market to make you uncomfortable first, and then reward you later. Those who can be patient during this phase are often the last ones standing.