
Bitcoin woke up this Monday with a clear statement of intent. By comparing the 4-hour and daily data, we can see that the correction may have ended.
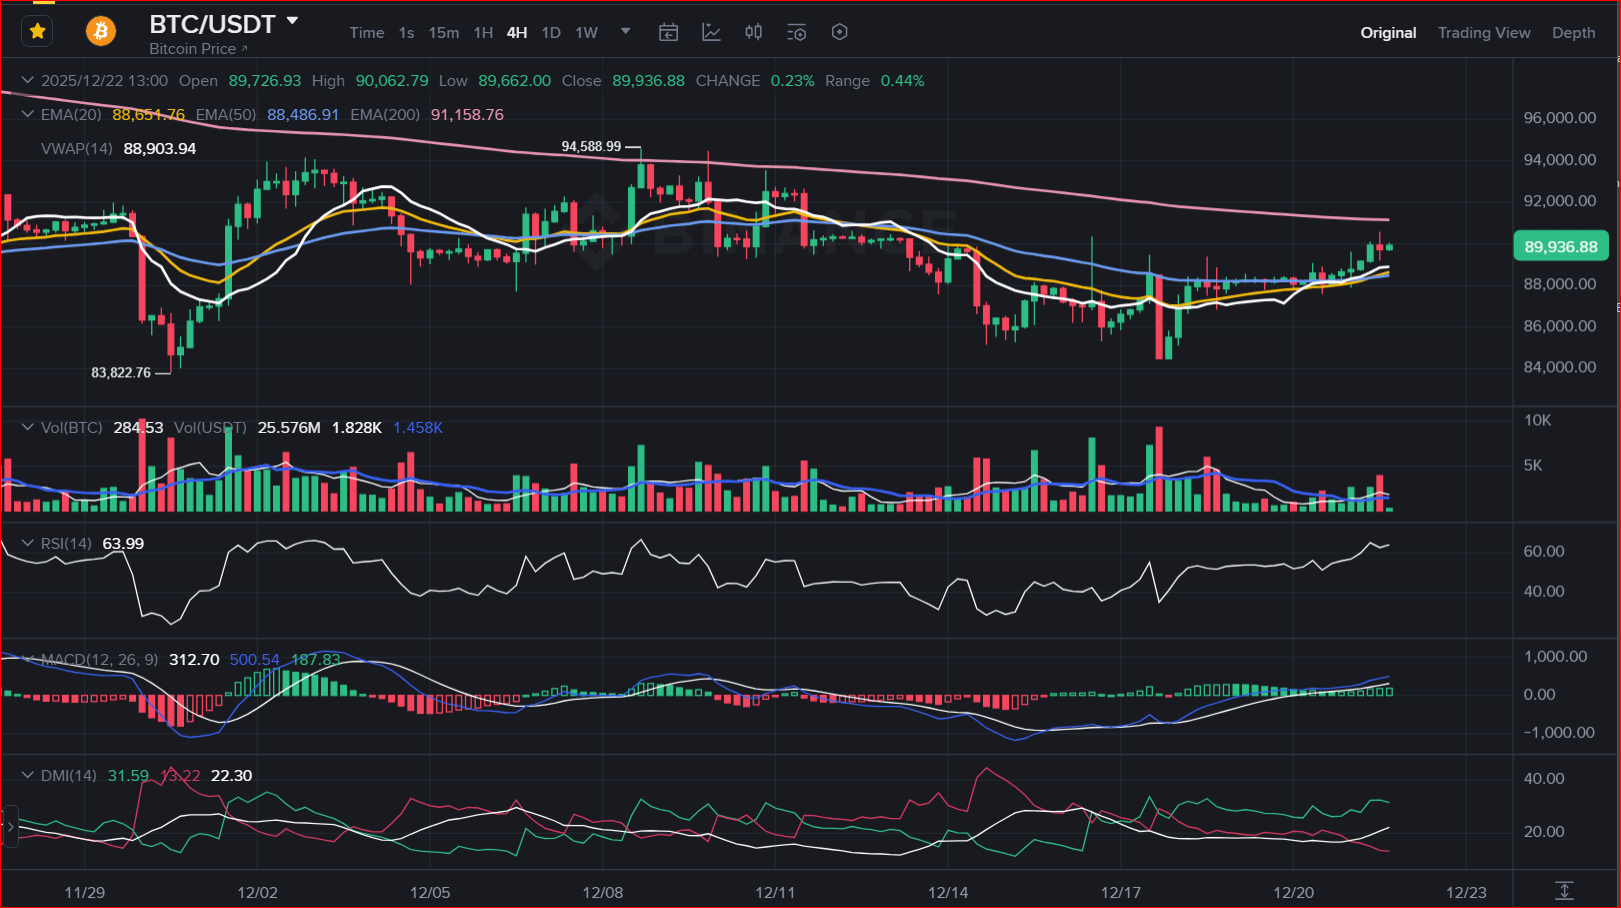
1️⃣ The Tactical Vision (4 Hour Chart): Clean Break
On Saturday we were fighting against resistance. Today, we've crushed it.
BTC ($89,936) is trading comfortably above the 50 EMA ($88,486) and the VWAP ($88,903).
RSI: At 63.99, it shows strong and decisive buying pressure. The next magnet is the 200-day EMA at $91.1k.
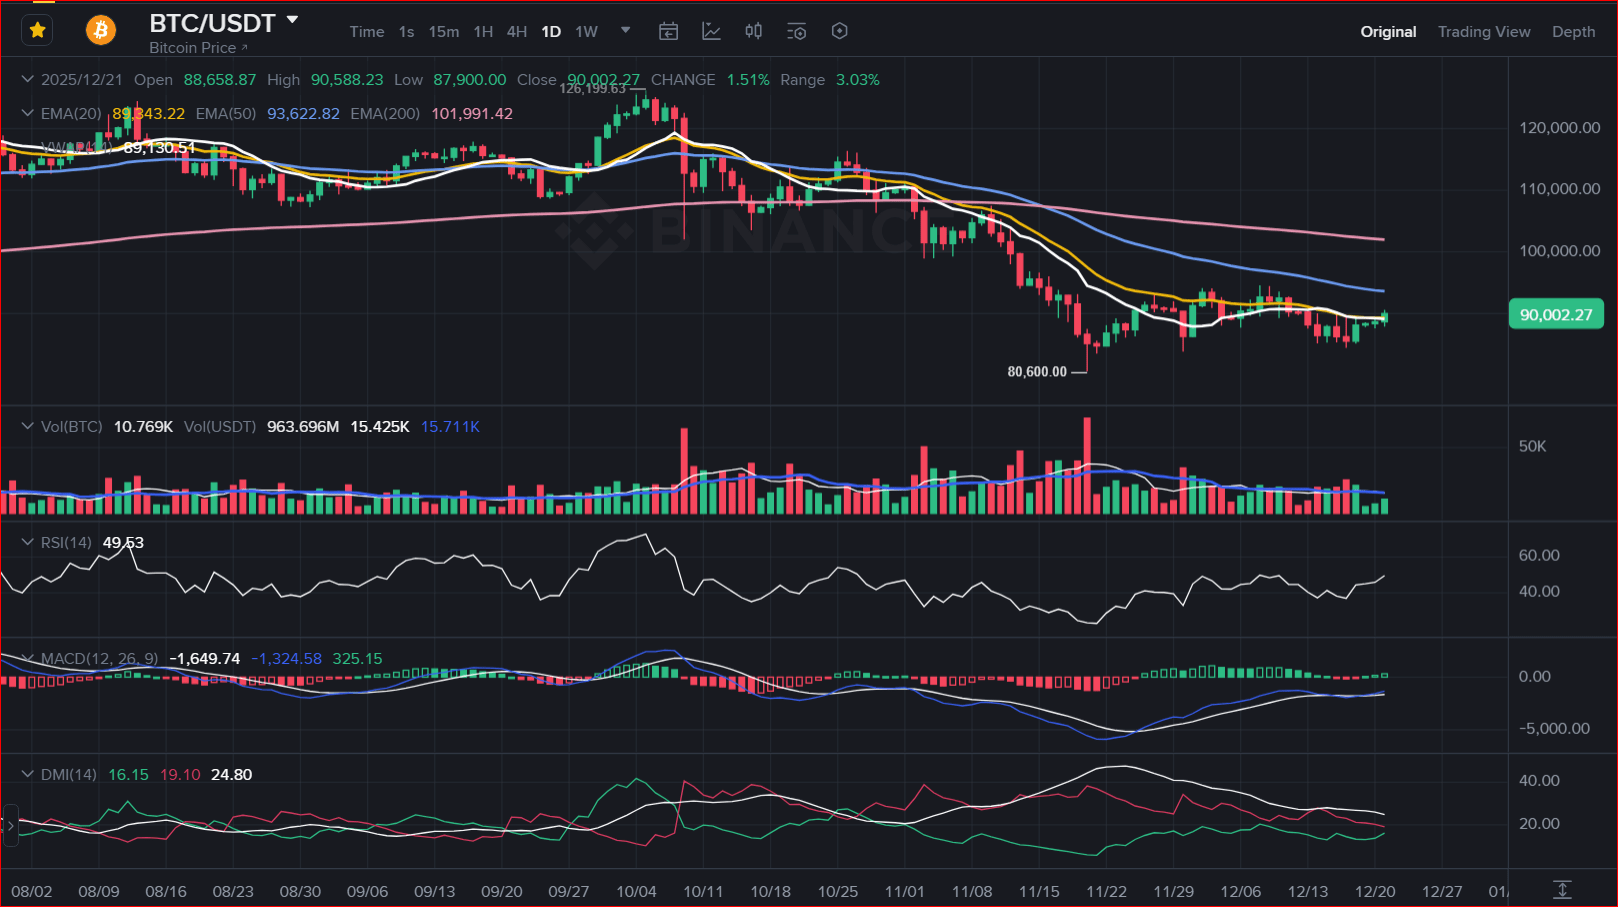
2️⃣ The Strategic Vision (Daily Chart): The "Golden Ticket"
Here's the most important thing this week: The price ($90,002) is trying to close above the 20-day EMA (Yellow Line), which sits at $89,343.
Recovering the 20-day EMA is usually the main signal that the macro uptrend is continuing.
🎯 Conclusion:
The timing is perfect. The 4H chart has provided the necessary boost to recover the key level on the Daily chart.
Bullish Scenario: If we close the day above $89,400, the path to $93k-$95k is clear.
Critical Support: $88,500 is the new floor to defend.
👇 Will Bitcoin reach $95k this week? Leave your prediction.
#bitcoin $BTC #MarketUpdate #cryptotrading #Bullrun #BinanceSquare
🇬🇧 English Summary:
BTC Deep Dive (4H vs 1D).
4H Chart: Breakout confirmed above the 50 EMA ($88.4k) and VWAP due to strong momentum (RSI 63.99).
Daily Chart: Major Signal. BTC is reclaiming the Daily 20 EMA ($89.3k). Closing the day above this level confirms the correction is over and targets $93k next.
