
While we still see many posts or news claiming that LTHs are selling more than ever, the reality is quite different.
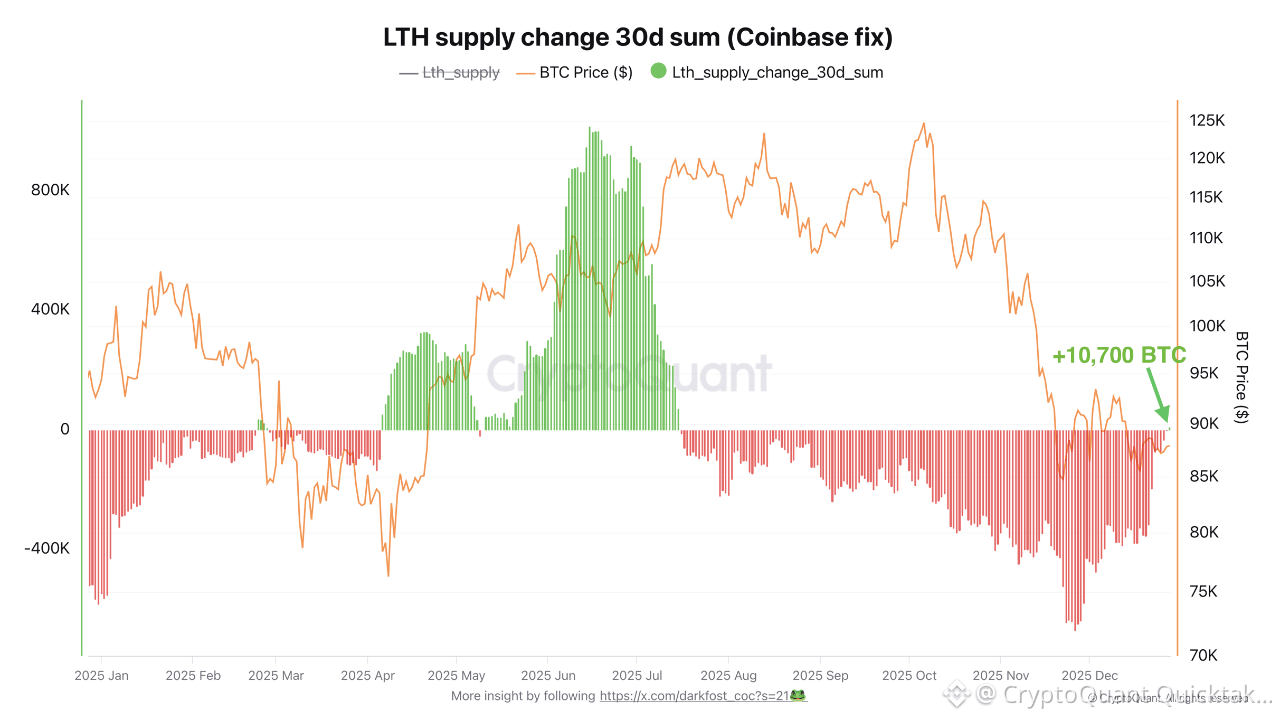
On this chart, which I adjusted to isolate the movement of nearly 800,000 BTC from Coinbase that was distorting LTH data, we can observe a clear shift in supply change.
🔹 LTH = coins held for more than 6 months
🔹 STH = coins held for less than 6 months
💥 Since July 16, the monthly LTH supply change (30 day sum) had been firmly anchored in a distribution phase until recently.
In other words, the share of supply held by LTHs had been steadily decreasing for months.
We have now moved back into positive territory, with around 10,700 BTC transitioning into long term held coins.
For now, this remains a very modest change, but it is not insignificant.
LTHs appear to have reduced their selling pressure to the point where their supply is starting to increase again, as STHs continue to hold their BTC.
👉 Historically, such shifts have often preceded the formation of consolidation phases or even bullish recoveries, depending on how the broader trend evolves.
Written by Darkfost
