
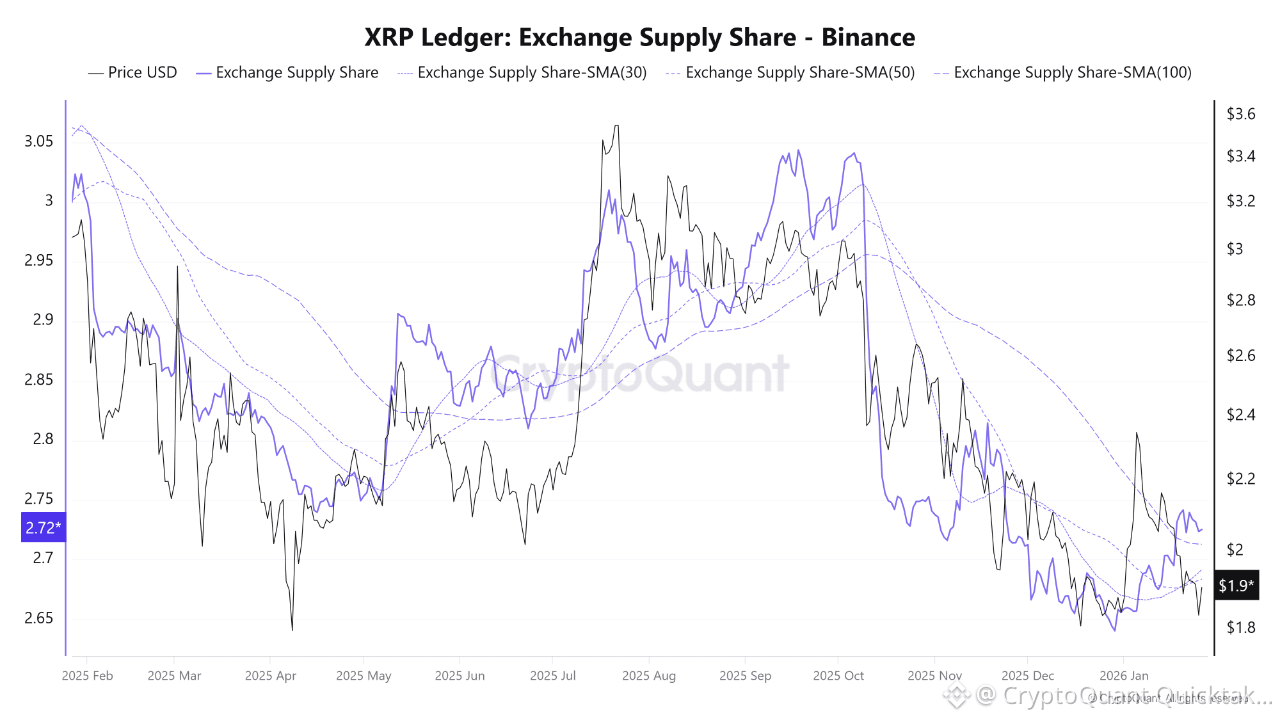
Exchange Supply Share (ESS) shows how much of XRP is held on exchanges. When ESS rises, it indicates XRP inflows to exchanges; when ESS declines, it means XRP is moving off exchanges. Historically, ESS and price have shown an inverse correlation most of the time.
February-April 2025 During this period, ESS declined steadily. The price first moved sideways and then broke out sharply to the upside. The reduction of supply on exchanges led to a delayed positive price reaction.
July-September 2025 In contrast, ESS started to rise in this period. While the price experienced high volatility, a market top formed and was followed by a downward move. This phase reflects distribution as exchange balances increased.
October 2025-A Critical Phase is particularly important. A sharp drop in ESS was followed by a strong price dump. The key point here is that the decline in ESS should not be interpreted as panic selling, but rather as a liquidity drain occurring simultaneously with the price decline.
Between November and December 2025, the lack of market volume also affected XRP. ESS remained flat at very low levels, while the price drifted downward gradually.
Current Situation at present, ESS is at the bottom zone, and the SMA(30), SMA(50), and SMA(100) are positioned above the price, indicating that the supply side has stabilized. The price is around the $1.9 level and is still responding weakly relative to ESS. Historically, this setup has tended to push prices higher with a delay.
When ESS stays at bottom levels for 2–4 weeks, price has typically shown an initial relief bounce followed by the beginning of a trend. We appear to be at the early stage of this phase; however, unlike previous instances, there is no volume confirmation. Therefore, any upside move may remain a short term reaction rather than a sustained trend.
Written by PelinayPA
