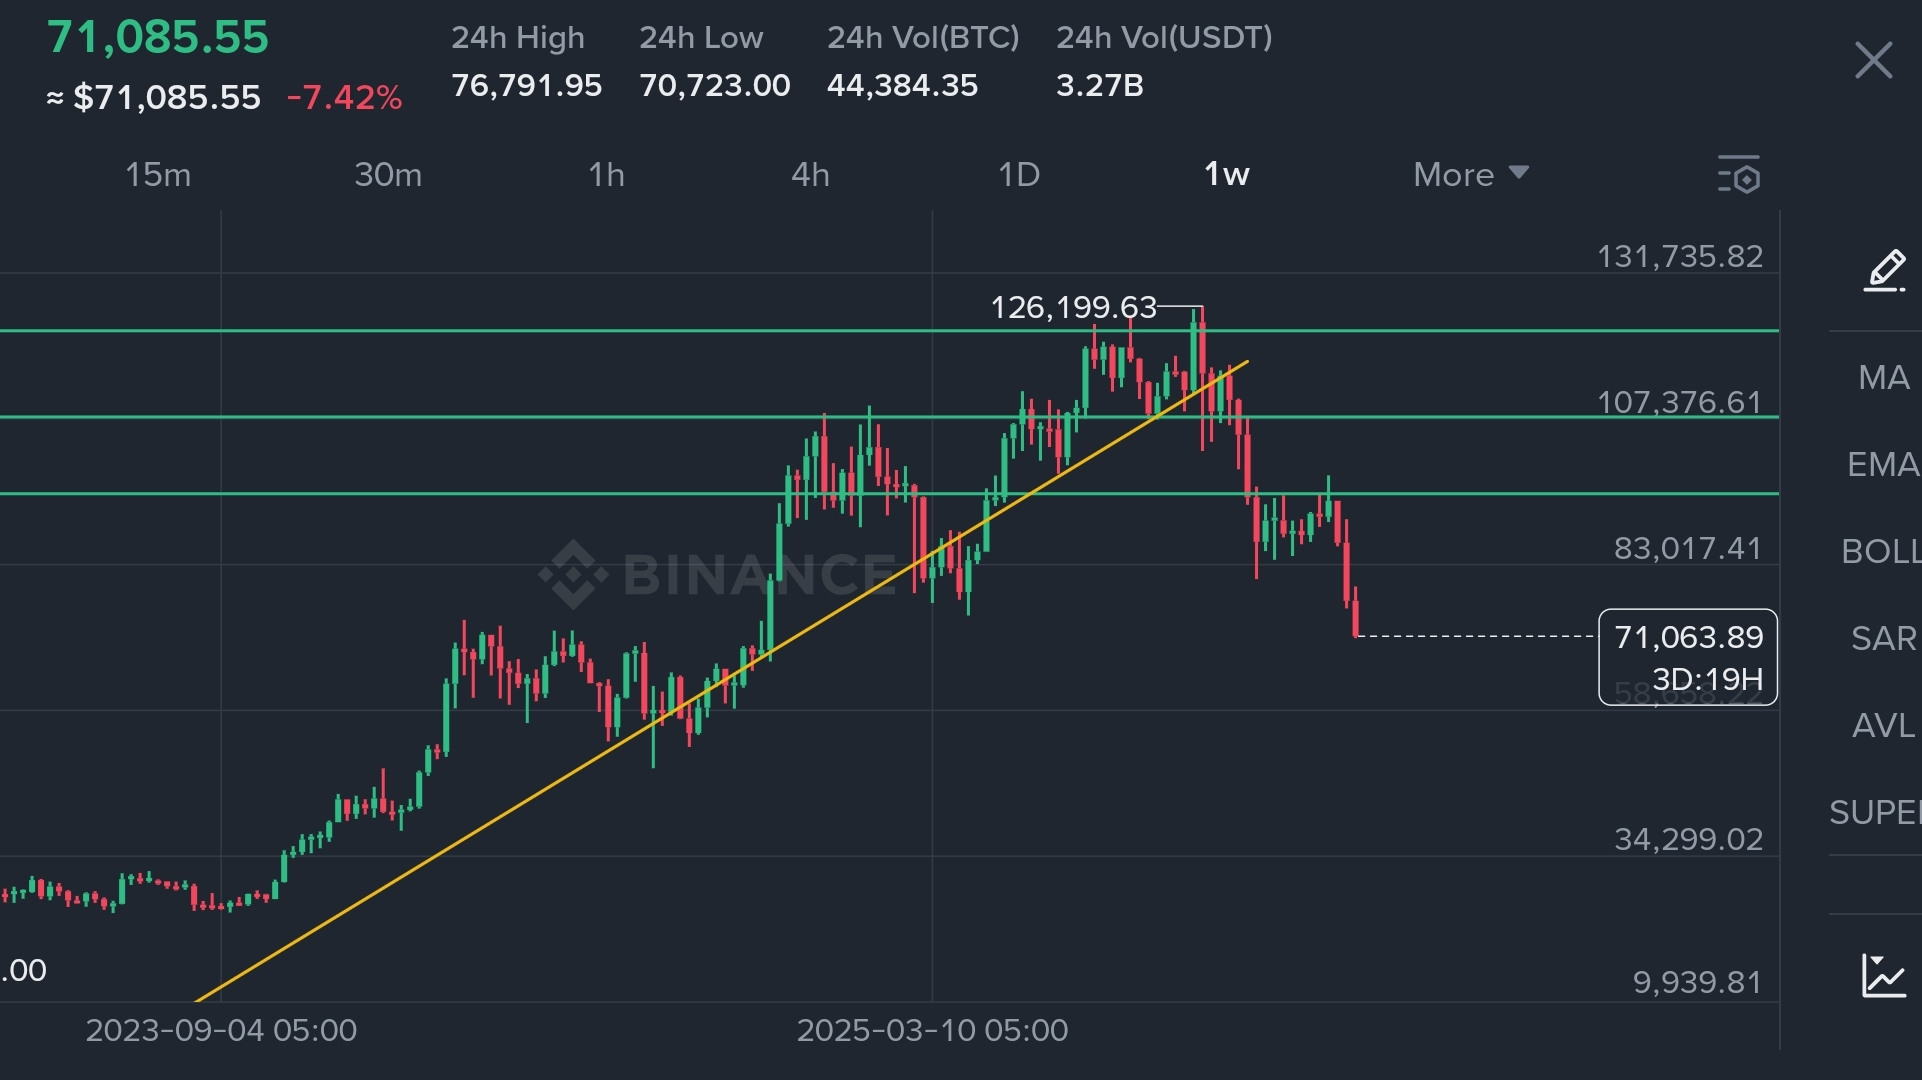


$BTC is currently at a massive crossroads on the weekly timeframe. After the explosive start to 2026, we are witnessing a significant "cooling-off" period that is testing the patience of every long-term holder.
The Macro View (Weekly Chart):
* Support Under Fire:
The most critical level to watch is the $68,500 – $70,000 zone. This area represents the 200-week Exponential Moving Average (EMA). Historically, as long as Bitcoin stays above this line, the macro bull trend remains intact. A weekly close below this could signal a deeper correction toward $60,000.
* Resistance Levels:
On the upside, the previous support turned resistance at $82,000 is the main hurdle. Bulls need to reclaim this level with high volume to invalidate the current bearish structure.
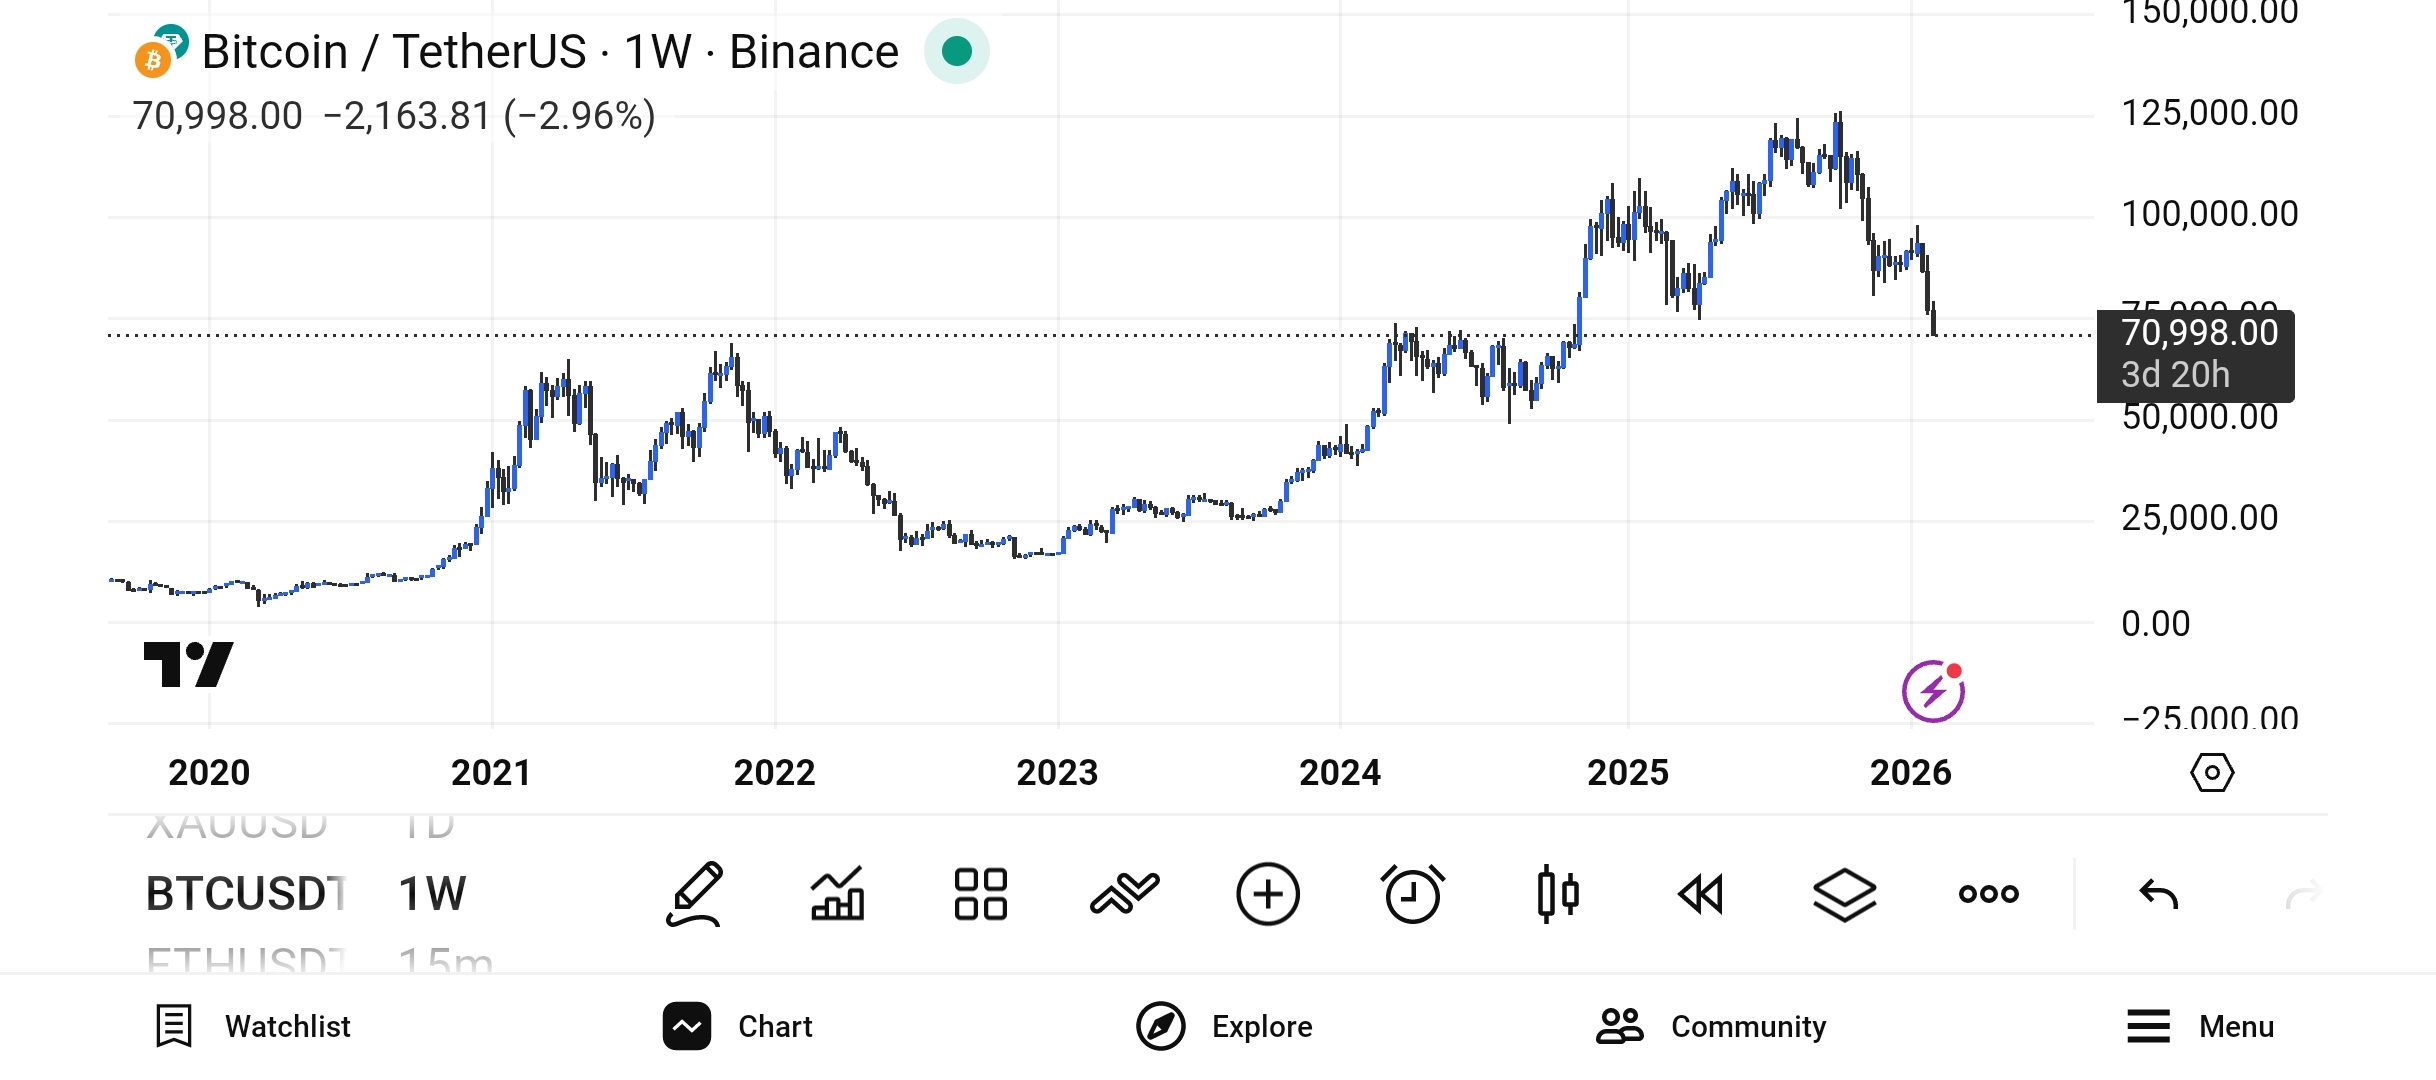
* Volume & Momentum:
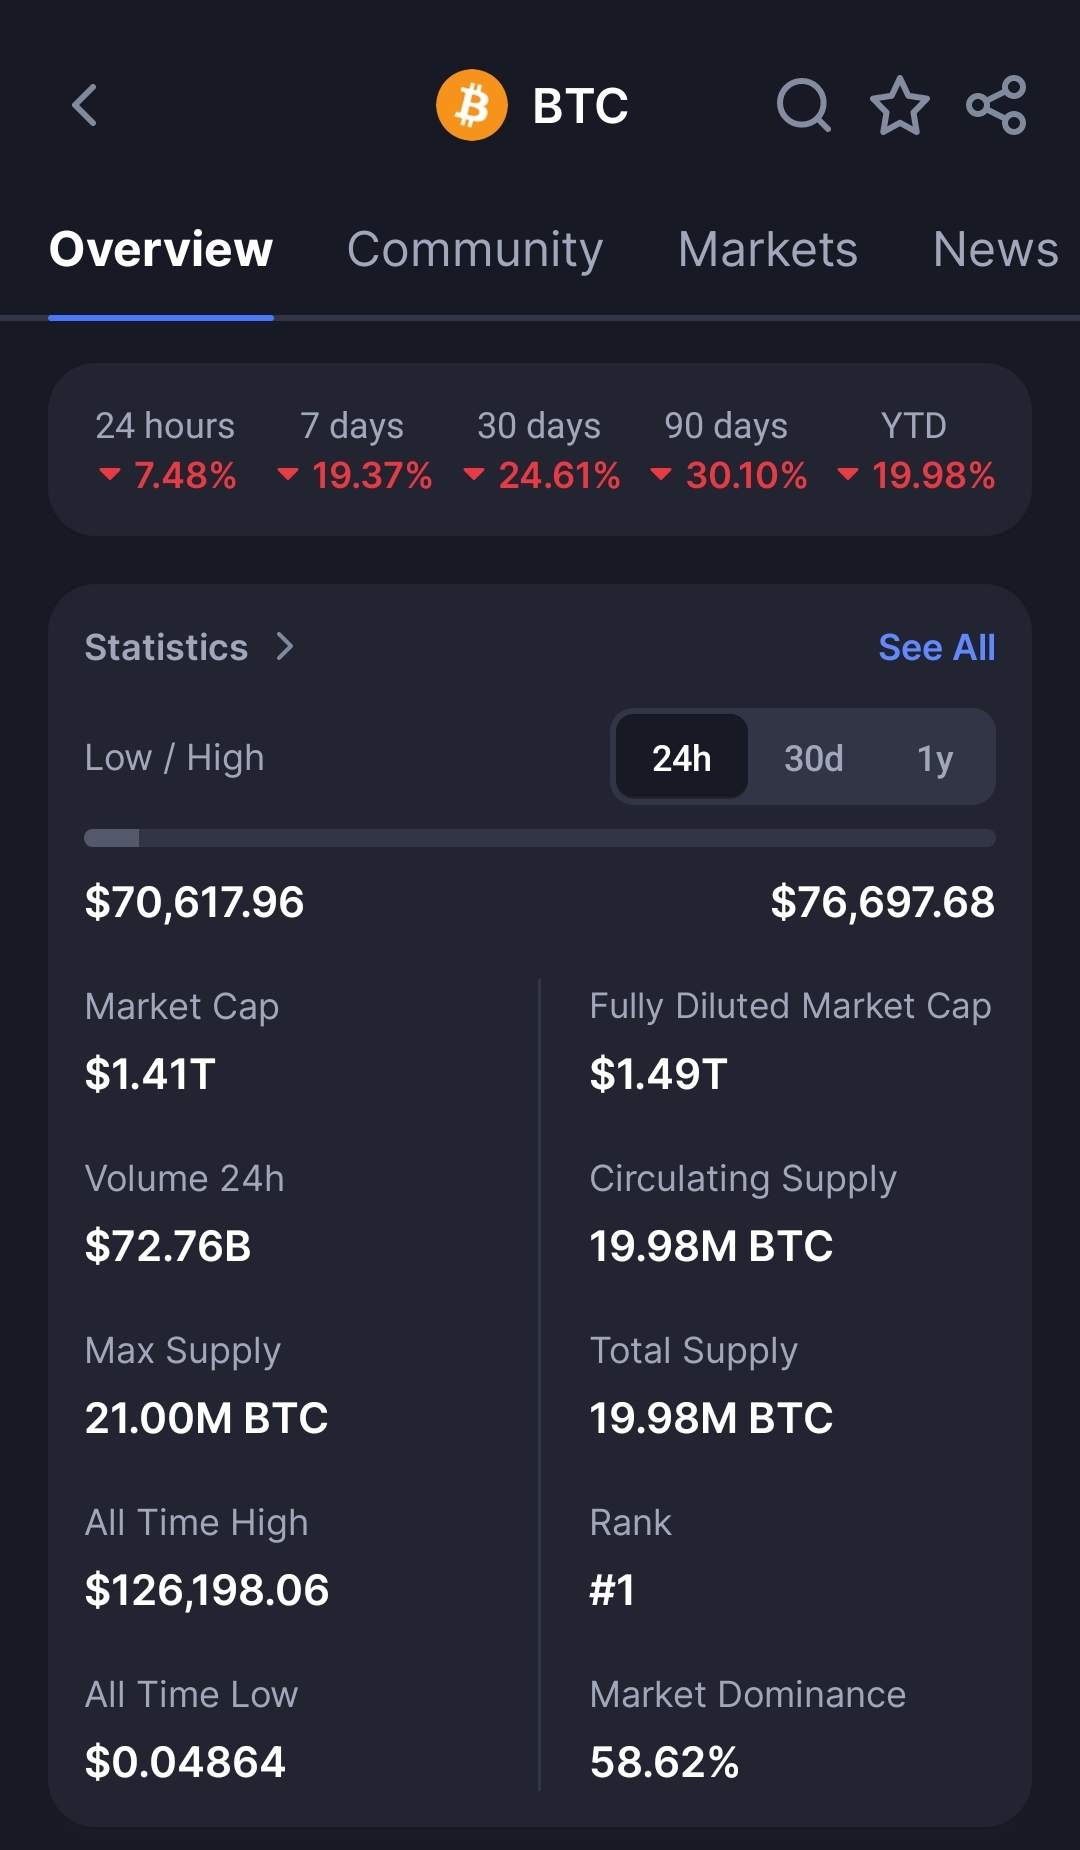
We’ve seen a spike in weekly selling volume, largely driven by ETF outflows and global macro uncertainty. However, the RSI (Relative Strength Index) is finally approaching the oversold territory for the first time in months, which often precedes a significant relief bounce.
* The "Golden Pocket":
We are currently sitting right in the Fibonacci retracement "Golden Zone." If the weekly candle closes with a long lower wick (a hammer candle), it would be a strong signal that the bottom is in.
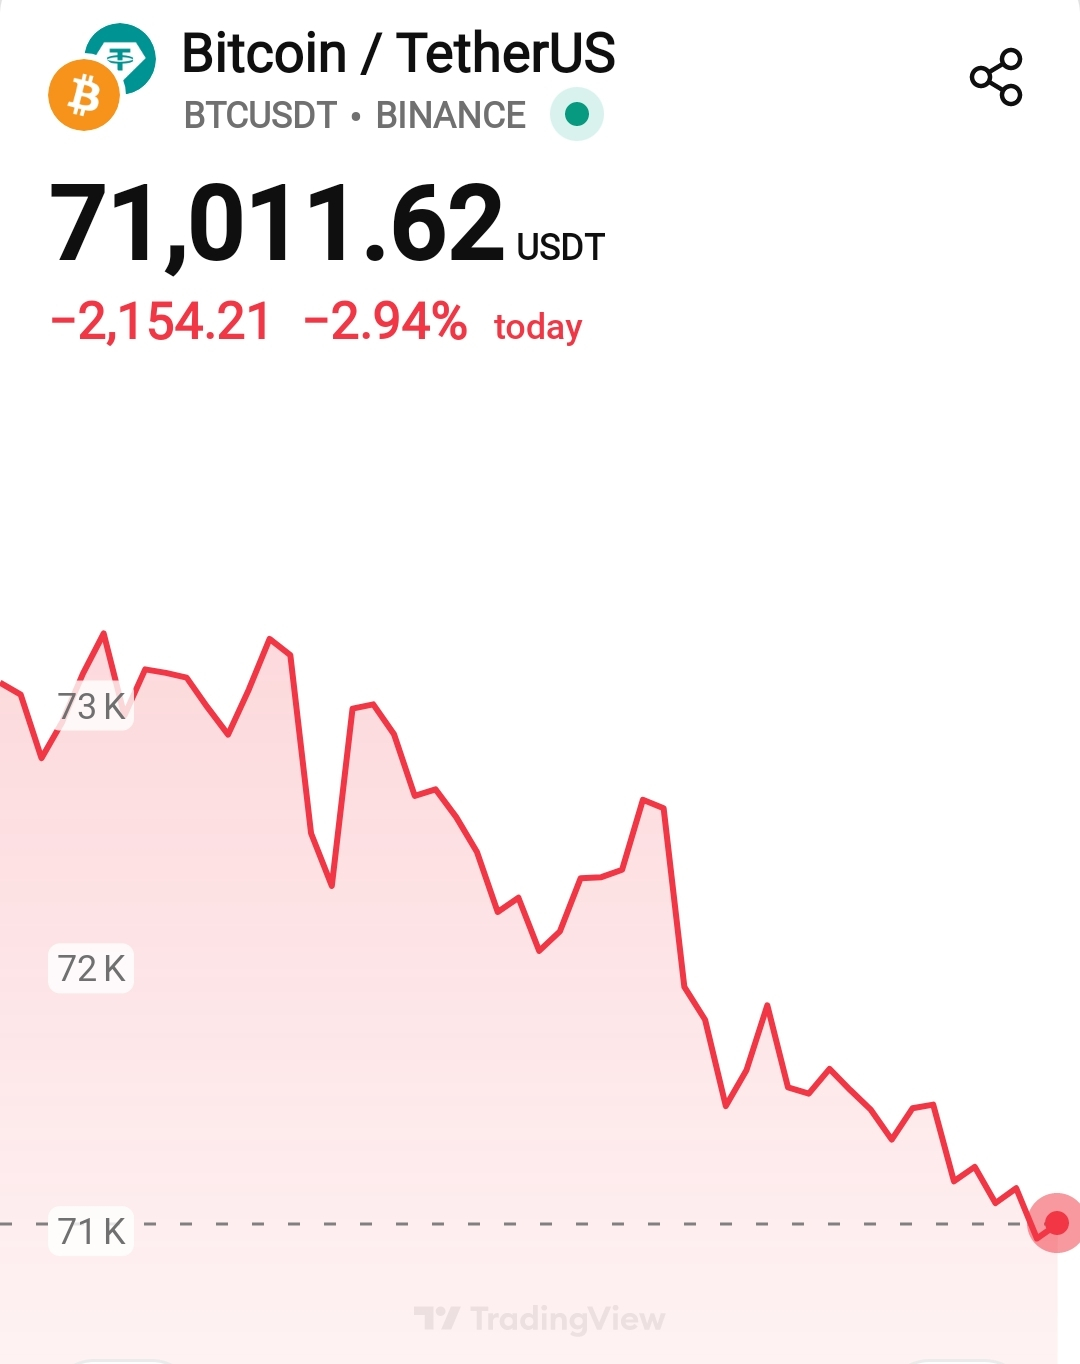
Market Sentiment:
While the short-term sentiment is "Fearful," the long-term fundamentals of the 2026 cycle—driven by institutional adoption and scarcity—remain strong. This weekly dip is likely a "shakeout" rather than a "breakout" for the bears.
Strategy:
For long-term investors, this is an accumulation zone. For swing traders, the safest move is to wait for a confirmed weekly reversal candle or a breakout above $82,500 before going heavy.
Is the bottom in, or are we heading to $60k? Drop your predictions below! 👇
#BTC #Bitcoin #WeeklyAnalysis $BTC #Crypto2026 #TechnicalAnalysis
