⏰ Updated at 14:06 on 07/08/2025
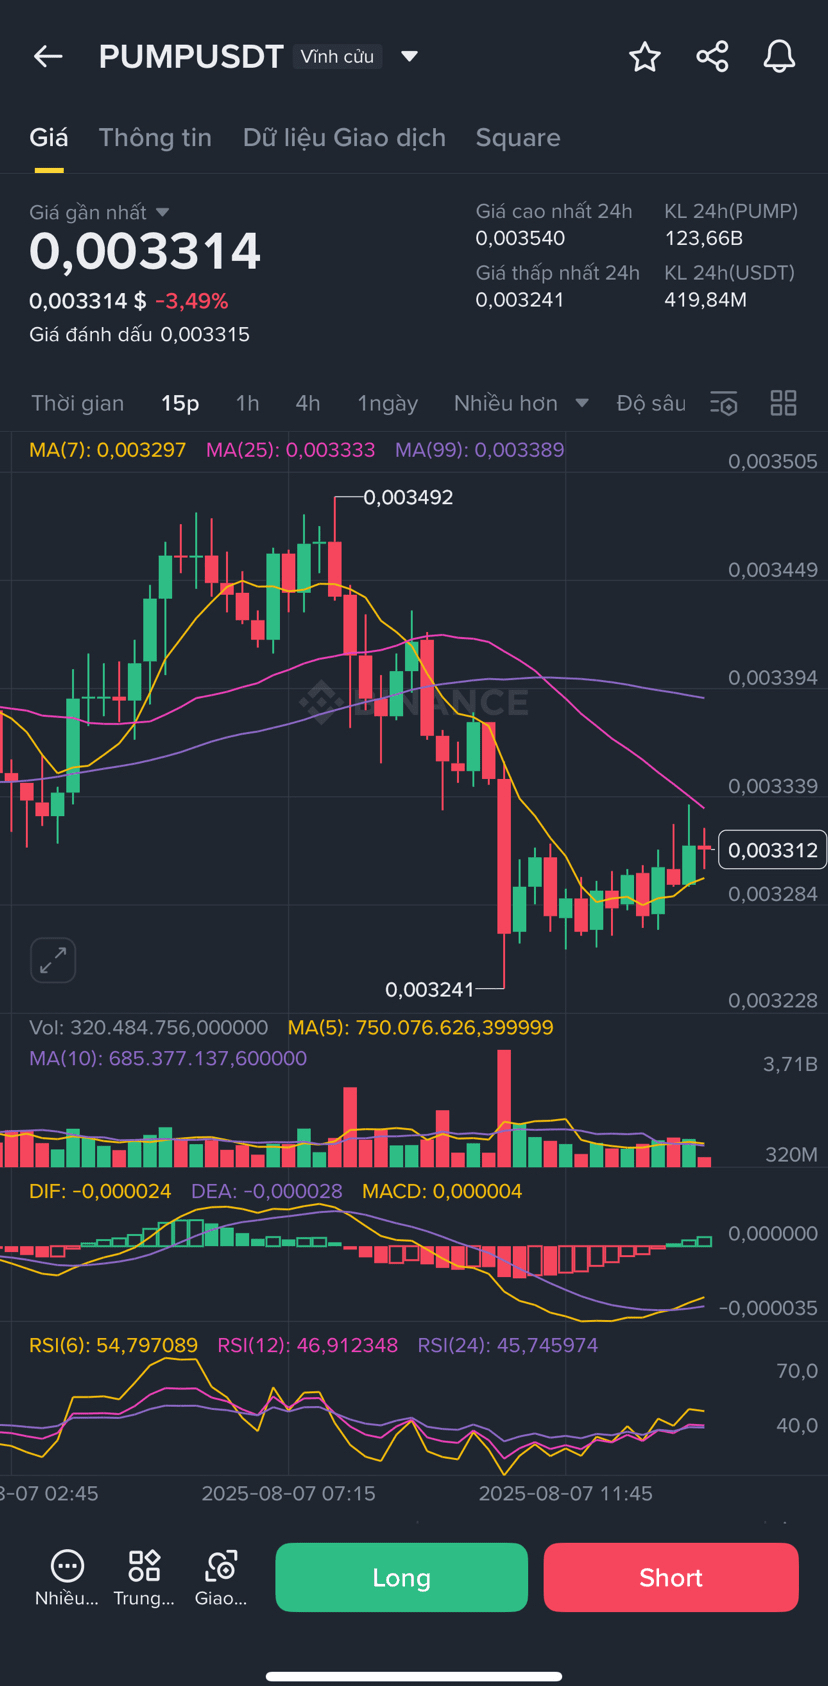
⟨c-8⟩ just experienced a significant price drop, but the noteworthy thing is that the price has bounced off the bottom area 0.003241 and is currently hovering around 0.00331. Many signs indicate that selling pressure is weakening and buyers are starting to return. So is this just a light breath, or is it a "discreet accumulation" area before PUMP bounces back?
🔍 I have closely examined various time frames – from 15 minutes to 4 hours – and discovered some quite interesting signals. Let’s take a look at what PUMP is "planning":
🕓 4h frame – Still maintaining the upward structure, just a technical correction
On the 4h frame, PUMP has made a beautiful breakout from 0.002424 to 0.003540, then corrected back to the MA25 area (0.003132) and is currently holding above this support zone. This is a signal that selling pressure is not really overwhelming.
MACD is still slightly negative but is almost horizontal, indicating that the decline has slowed down. RSI(6) is around 52 – still maintaining some momentum.
➡️ I see this as a healthy correction after a hot increase. If PUMP holds above 0.00313, the chance of recovering back to the peak area is quite bright.
⏱️ 1h frame – Starting to show retracement strength, price is testing MA7 again
The 1h frame shows that PUMP is trying to bounce back after hitting the bottom at 0.003241. The most recent candle has narrowed the decline, RSI(6) is at 41 – indicating that selling momentum is weakening, allowing room for recovery.
Although MACD is still negative, it has shown signs of contraction, indicating that selling pressure is not as strong as before. The price is approaching MA7, and if it surpasses this, it will be the first positive signal in the recovery phase.
➡️ This is a quite sensitive frame, if the price exceeds MA25 (0.003385) then it is highly likely to retest the area 0.00345.
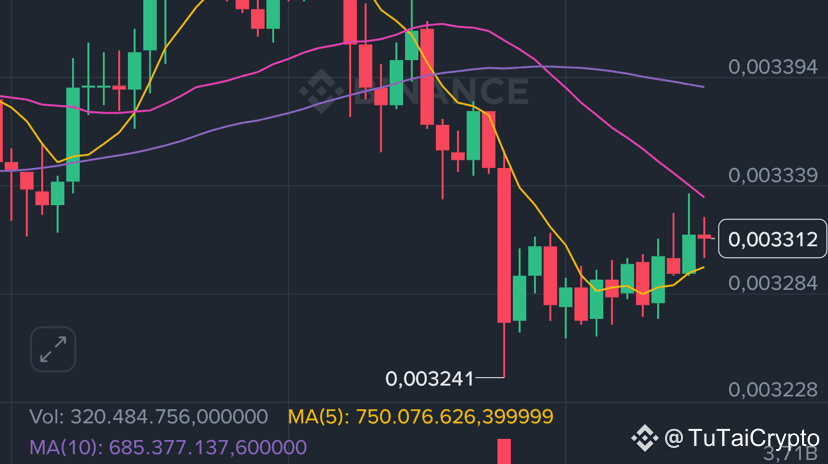
🕒 Frame 15m – Retracement candle, sign of short-term bottom formation
In the last 15 minutes, several beautiful green candles have emerged around the bottom area 0.003241. RSI(6) has exceeded 50 (currently around 54), indicating that buying power is returning.
MACD is also changing direction, the histogram is nearing 0 – a light recovery signal is becoming clearer. The price has just slightly surpassed MA7 and MA25 → it may continue to recover if it maintains above this area.
➡️ I assess this as a "short-term takeoff" phase. If it surpasses MA99 at 0.003389 and maintains above it, PUMP could recover to 0.00345 – 0.00350.
📌 Summary of personal perspective:
PUMP is in a technical correction phase after a strong increase. The upward structure on the 4h frame remains intact, while the 1h and 15m are signaling a short-term recovery. If it holds the support area 0.00324 – 0.00328, the likelihood of a bounce is high.
🎯 Personal trade setup:
→ Note: Prioritize Long, clear risks
Entry (place order): 0.00328 – 0.00332
Stop Loss: 0.00322 (below the nearest bottom)
Take Profit 1: 0.00342
Take Profit 2: 0.00348
Take Profit 3 (extended): 0.00355+
📌 Order management: When TP1 is reached, move SL to breakeven to reduce risk.
🚀 The scenario I am monitoring:
🔸 Bull case: PUMP holds above 0.00328, surpasses MA25 (1h frame) → retest the peak area 0.00354
🔸 Bear case: Loses 0.00322 → easily adjusts deeper to 0.00310
👇 What do you see while observing PUMP? Short-term long or wait for clearer trend confirmation? Please share your comments!
👉 I mainly trade on Binance – anyone new can use the link below to permanently reduce trading fees (and support me a bit): thank you very much everyone
Referral code: GRO_20338_SMYIM
👉 https://www.binance.com/referral/earn-together/refer-in-hotsummer/claim?hl=en&ref=GRO_20338_SMYIM