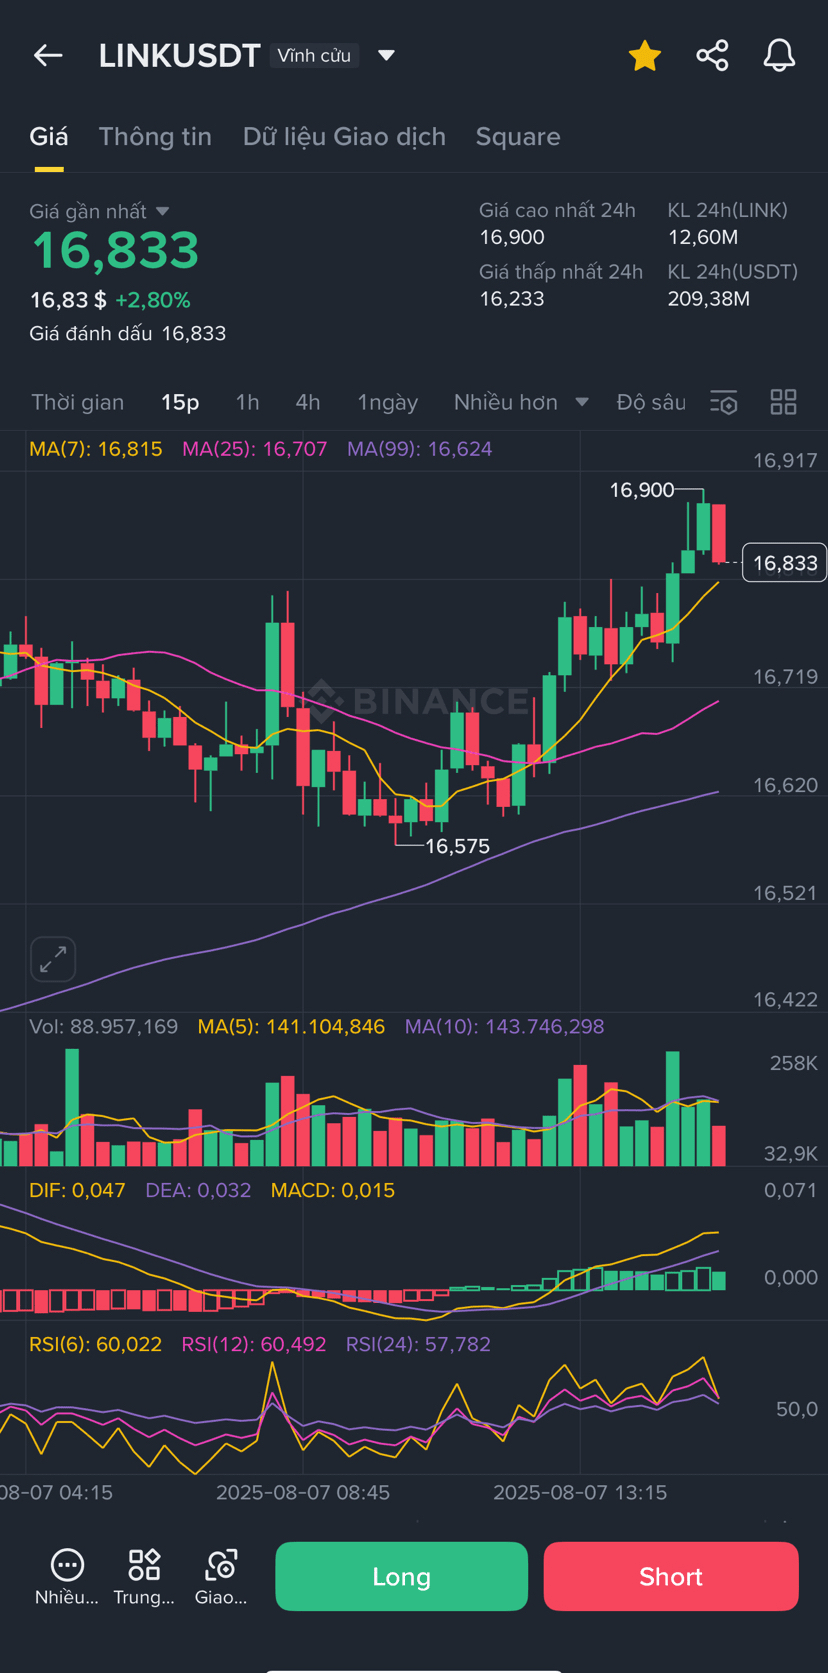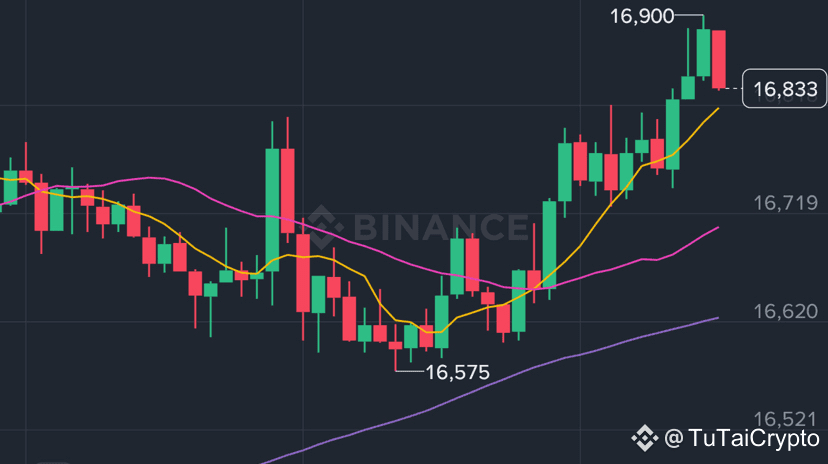
⏰ Updated at 15:40 on 07/08/2025
After a strong drop to the range 15.4, it did not fall into a prolonged state of weakness; on the contrary, it quickly rebounded with a clear buying force returning. Currently, the price is hovering around 16.83 – a sign that the market is entering a potentially strong recovery phase. Could this be the “breathing zone” before a new breakout? Let's delve into each time frame to analyze the developments behind this recovery!
🕓 4h frame – Re-accumulating around MA25, trend is changing direction
In the 4h frame, LINK has formed a bottom at 15.428 and then rebounded quite well. The price is currently above both MA7 and MA25, indicating that the short-term trend is recovering. However, MA99 is still far above – suggesting that it may need more time to accumulate.
MACD has crossed above the signal line and is nearing the positive zone → selling pressure has decreased, showing signs of a shift to an upward trend. RSI(6) around 61 – recovery force is quite stable.
=> LINK is accumulating again on a higher price base, if it holds the range 16.5 – 16.6, it is likely to continue testing MA99 around 17.5.
⏱️ 1h frame – Strong recovery, regaining MA99
The 1h frame shows LINK has bounced from the bottom of 16.023, currently surpassing MA7, MA25, and MA99 – a very positive trend. The recent candles all have long bodies and stable volume → confirming that money flow is returning.
MACD is positive and clearly separating from the signal, RSI(6) has reached 77 → may be overbought in the short term but shows no signs of divergence.
=> This frame reflects a clear recovery force. If it holds the range 16.6 – 16.7, LINK could definitely move up to retest the peak range of 17.0 – 17.2.
🕒 15m frame – Slight fluctuations, but there is support
In the 15-minute frame, after reaching 16.9, LINK had a slight adjustment. However, the recent red candles have long lower wicks, indicating strong buying support around the range of 16.7 – 16.8. RSI(6) is at 60, still in the safe zone.
MACD is still positive and the histogram is slightly expanding → no clear signs of weakening yet.
=> LINK is consolidating short-term after a hot surge. If it continues to hold above 16.7, it could prepare for a breakout at 17.0.
📌 Summary of personal view:
LINK is in a recovery phase after a deep correction. The 4h and 1h frames are both showing clear upward signals. I am monitoring the range 16.6 – 16.7 as a new support area. If it holds, there is a high possibility it will continue rising to the range 17.2 – 17.5.
🎯 Personal trade setup:
Order: Long
Entry: 16.65 – 16.75
Stop Loss: 16.33 (below MA25 in the 4h frame)
Take Profit 1: 17.10
Take Profit 2: 17.50
TP3 (if breakout): 18.00
📌 Order management: When TP1 is reached, move SL to breakeven to optimize risk.
🚀 The scenario I am monitoring:
🔸 Bull case: LINK holds above 16.6 → breaks 17.0 → heads towards MA99 (17.5)
🔸 Bear case: LINK breaks below 16.3 → may retest the range 15.9 – 16.0
👇 Are you holding LINK and confident this recovery will be sustainable? Or are you planning to take profits early? Let's discuss!
👉 I mainly trade on Binance – anyone new can use the link below to reduce trading fees permanently (and support me a bit): thank you everyone
Invite code: GRO_20338_SMYIM
👉 https://www.binance.com/referral/earn-together/refer-in-hotsummer/claim?hl=en&ref=GRO_20338_SMYIM