Monthly line, just closed. 1. The continuous three candlesticks in July, August, and September, is the increase in candlestick height getting smaller? July was a large upward candlestick, and August's trading volume was slightly larger than July's. The candlestick body has already become much shorter than August's, and the upper shadow is quite long, indicating a potential volume stagnation. September's candlestick directly turned into a downward candlestick, and it was extremely low volume, proving that there are fewer people chasing high prices at high levels. Without buying pressure, how can prices rise? Looking at the comprehensive situation of July, August, and September, it shows a process of bullish exhaustion and a shift to bearish dominance. 2. The left-side horizontal resistance at 4630 was not surpassed. 3. The MACD fast and slow lines and the energy bars are both diverging. Therefore, from the monthly perspective, the outlook is severely bearish.

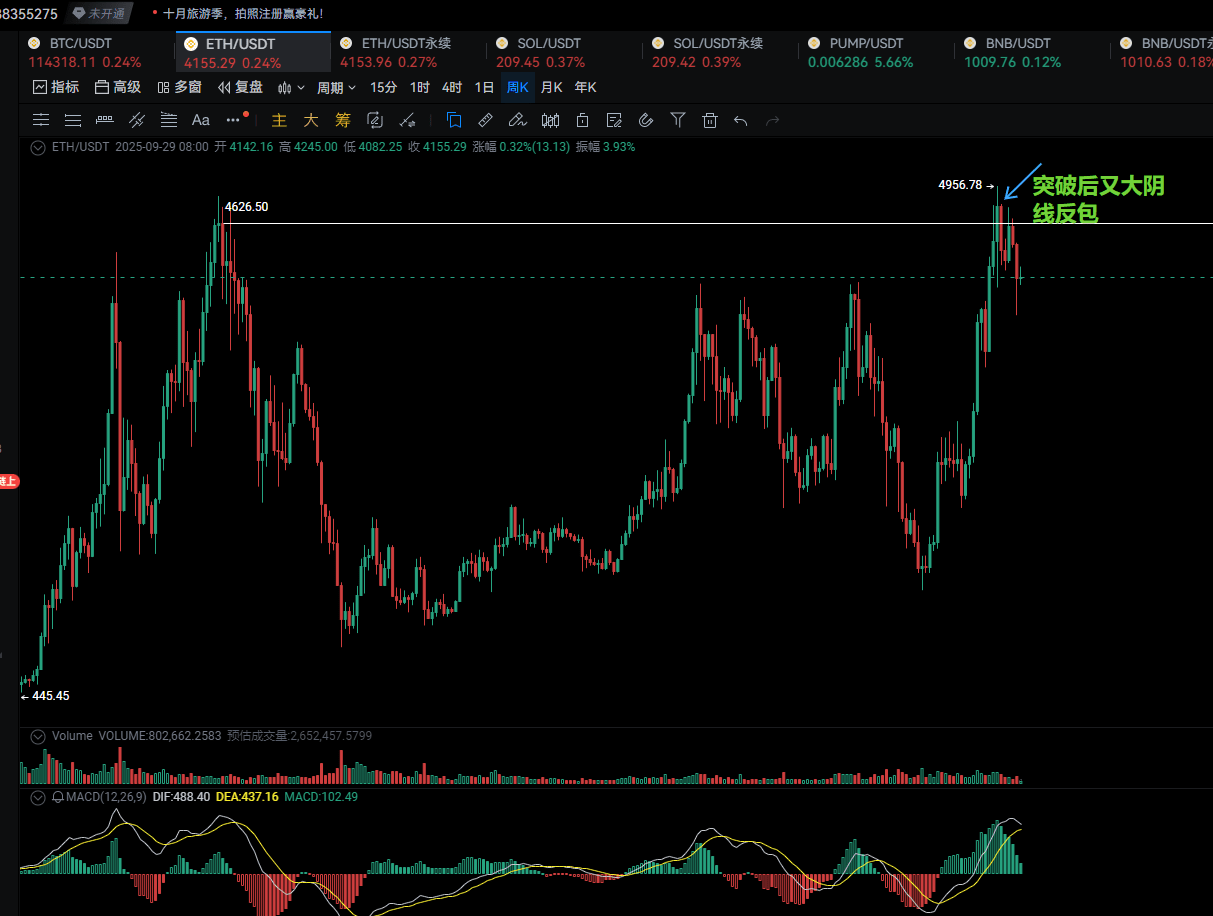
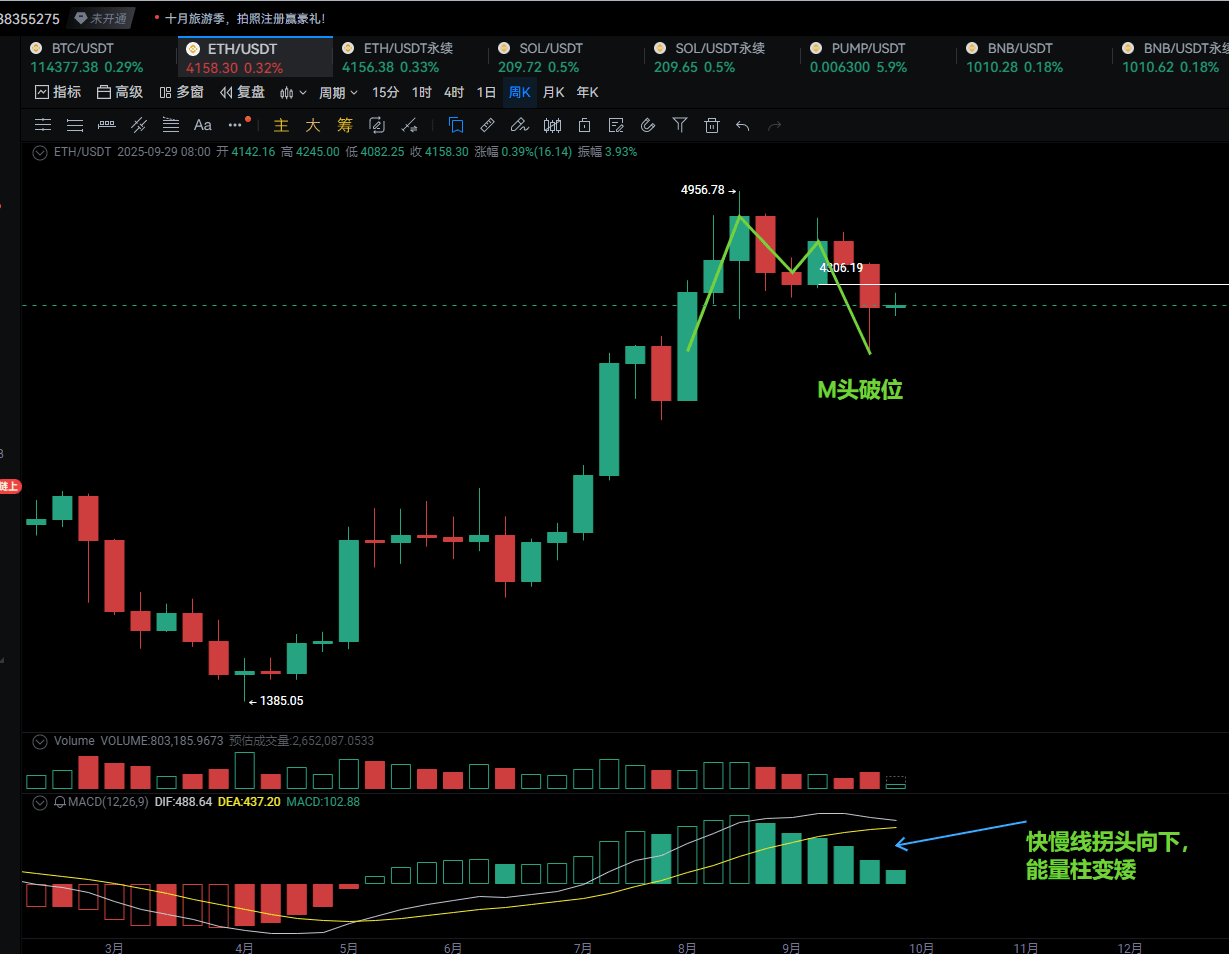
Weekly chart, first, the left horizontal resistance at 4626, after the breakthrough of the medium positive candle, there was a large negative candle that wrapped around, indicating a false breakout, which means the 4626 resistance is still valid; second, the small double top breakout; third, the MACD fast and slow lines have turned down at a high position, and the energy bars have become shorter, indicating insufficient momentum. Therefore, the weekly chart is also bearish.
Daily chart, complex double top structure, the large negative candle has effectively broken the neckline with increased volume, and it is currently undergoing a pullback. Normally, the pullback should not exceed the opening price of the large negative candle that broke below, but this pullback has gone a bit too far. There is a possibility of a slight upward pullback to around 4273. In short, the top structure has broken, which is definitely bearish. Moreover, you can see that in the morning close, the negative candle almost engulfed the positive candle from the day before yesterday, indicating a trend reversal from bullish to bearish, and the trading volume has also increased, with heavy selling pressure here.
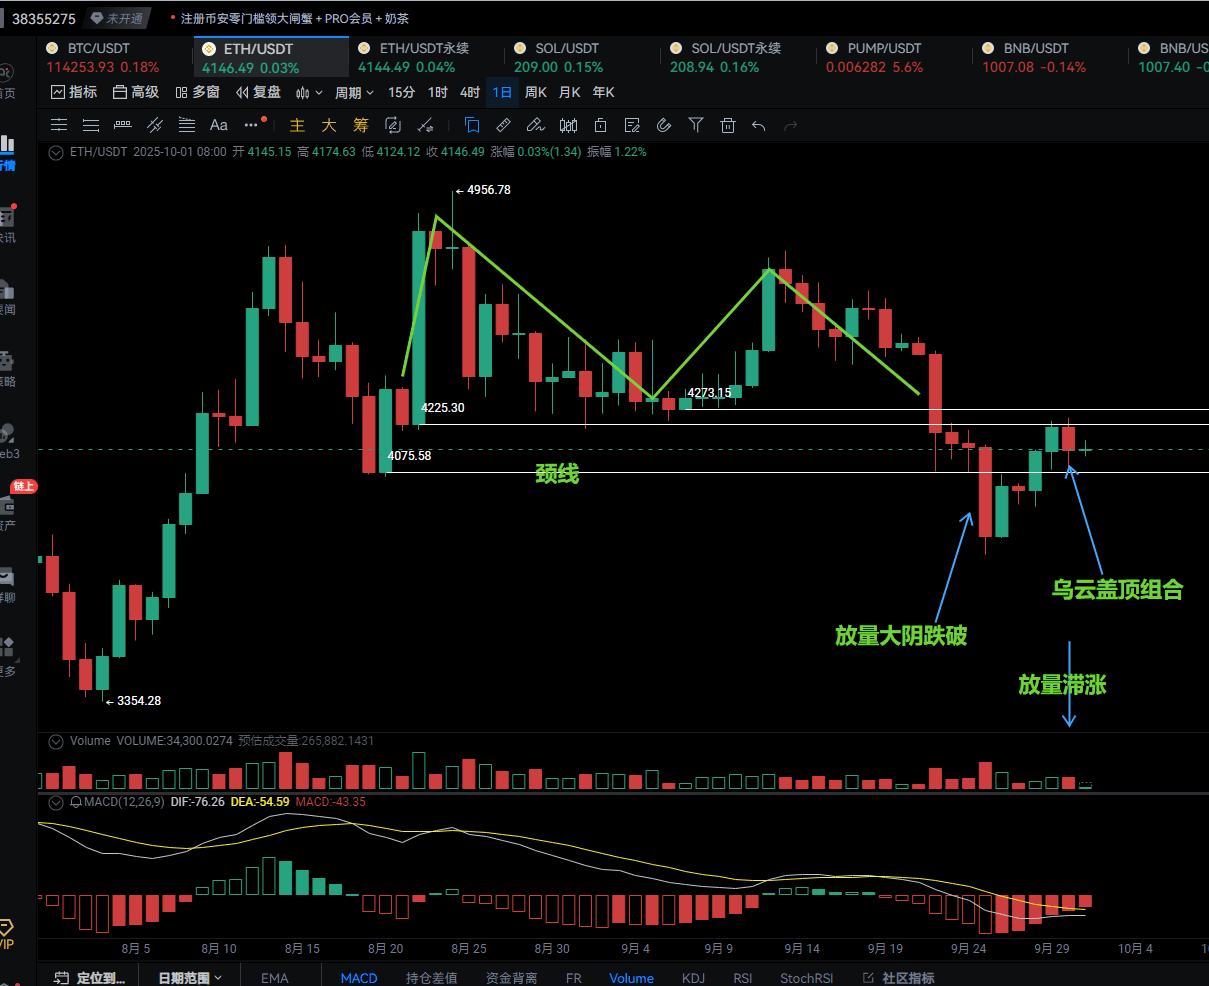
In summary, the monthly, weekly, and daily levels are consistently resonating downwards. The daily and 4-hour charts rebounded to the resistance level, and after the close, there was no breakthrough. The stagnation candlestick indicates a short opportunity. It is recommended to short at 4225, with a stop loss at 4250 and a take profit target at a minimum of 3874, and further down to 3498. If you have spot assets, hurry up and liquidate to save yourself.


