The day before yesterday, I placed several orders, following the first point, and all short orders were filled. When the market dropped significantly at night, I made a substantial profit. At that time, I was seeking stability and didn't place any left-side orders, resulting in missing the market movement. I felt quite frustrated during the day yesterday. Last night, before going to bed, I noticed that Bitcoin looked quite weak and thought it could only bounce back to 92000, but when I woke up at night, it had directly broken through and triggered my stop loss. So everyone should understand that both left and right sides have their pros and cons. For instance, on the left side, if you identify several levels of resistance, you don’t know which one will be effective. If you place orders too low, you might miss out on the significant movement, and sometimes you get hit. If you place orders too high, you might miss the market as well. Additionally, sometimes the market moves at night, and you can't keep watching the screen, so you can only place left-side orders. The right side is certainly more stable, but sometimes it spikes up and then drops, making the entry point worse when you wait for the candle to close. Ah, trading is really quite difficult. Brothers, do you think it’s hard? Let’s interact in the comments section.
One more thing, after my analysis over the past few months, although most of it is correct, there have been some mistakes as well. So you mustn't think I'm amazing and go all in recklessly. My skills are just a bit better than most of you, that's all; at most, I'm just a retail trader, and sometimes I chase highs and cut losses. Don't have the mentality of wanting to get rich quickly through contracts; it’s good to earn a stable living through low-leverage compounding. Once you go in too deep with contracts, it could go to zero. You need to save bullets for buying spot during a bear market; that's the way to go. I personally don’t dare to go all in with contracts; I always use light positions with low leverage, ready to exit when the situation doesn’t look good. What I mean is you need to be responsible for your own capital, manage your positions well, and don’t blame me if you get liquidated. Now let’s talk about the BTC market.
One, monthly line. The support at 82550 has held up so far without breaking. As long as Bitcoin closes this month with a spinning top, doji, cross, or pin bar, like the current line, there’s a 95% chance there will be another round of market trends. Old followers know that I focus on structure; my criterion for judging the end of a bull market is a structural breakdown. Currently, the weekly top structure hasn’t formed yet, let alone broken; the rebound target is around 110000. I looked closely at the charts of SOL, BNB, and ETH last night, and they are really performing well. There are only 19 days left in this month, so it’s time to position in the spot market. We can't stay in a short mindset forever; otherwise, we will miss this round of upward movement again. Some people say the monthly MACD has crossed downward, so a big drop is coming, right? Can it still rise? Regarding this issue, those who frequently read my articles know that I have never mentioned golden crosses or death crosses; indicators are just references, with the K line being the priority. As long as the monthly support holds, a death cross doesn’t matter; it can still rise. If you don’t believe it, look at SOL’s monthly line; didn’t it have a death cross in March, but later it rebounded by 154%?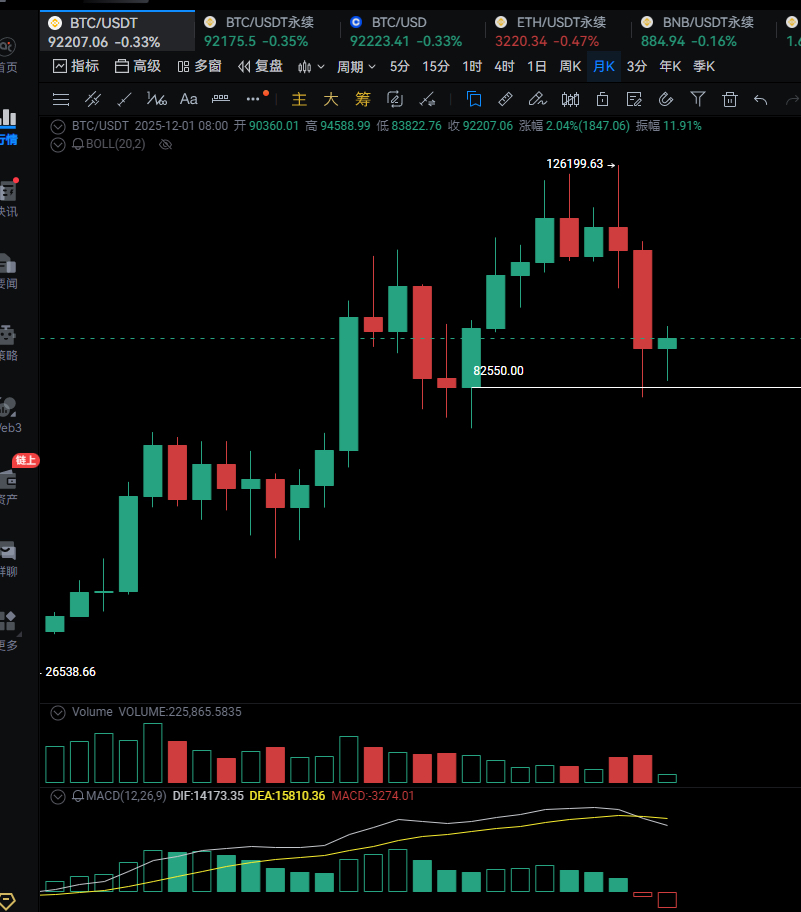
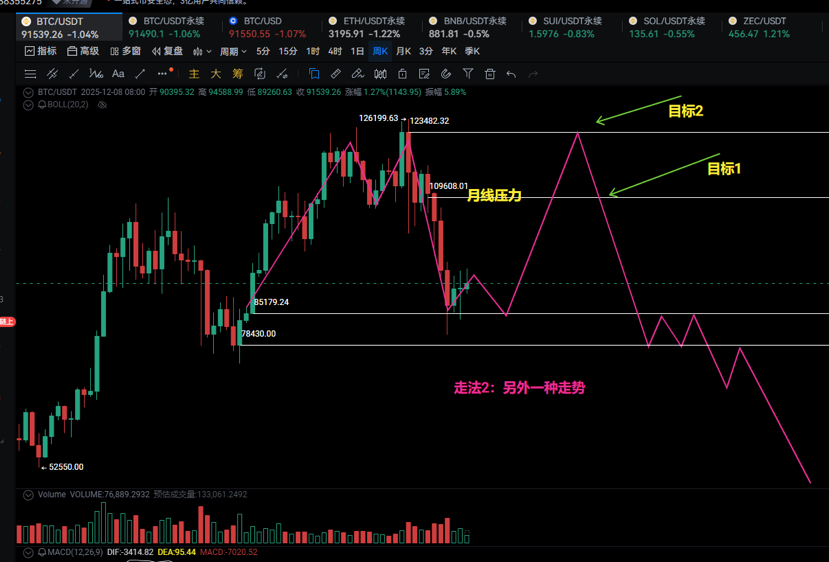
Two, weekly line. Previously, I always looked at the breakdown of the weekly support at 78430, then rebounding to form the right shoulder of a large head and shoulders top. If it doesn't follow this path, it will miss a round of market trends. Another possibility is that the weekly line at 85179 doesn't break, forming a bottom structure on the daily line here, and then rebounding. To what height will the rebound reach? It could be 110000 or 120000. Why do I think of this path? First, 85179 is the opening price support of a large bullish candle on the weekly line, created by the strong hands, and the daily line tested it twice without breaking; second, on November 21, that daily K line had huge volume with a long lower shadow, indicating strong buying pressure, and liquidity has been mostly taken by the strong hands; third, the market is generally bearish; even those who don't see it as bearish predict a drop to 70000 or 60000, and there are others like me who think it will drop to 78000, and with everyone thinking this way, the strong hands are unlikely to continue pushing down; fourth, there have already been three interest rate cuts in the second half of the year, improving liquidity somewhat. These factors are enough to support the view of another round of market trends, and of course, the main point is that the top structure hasn't broken.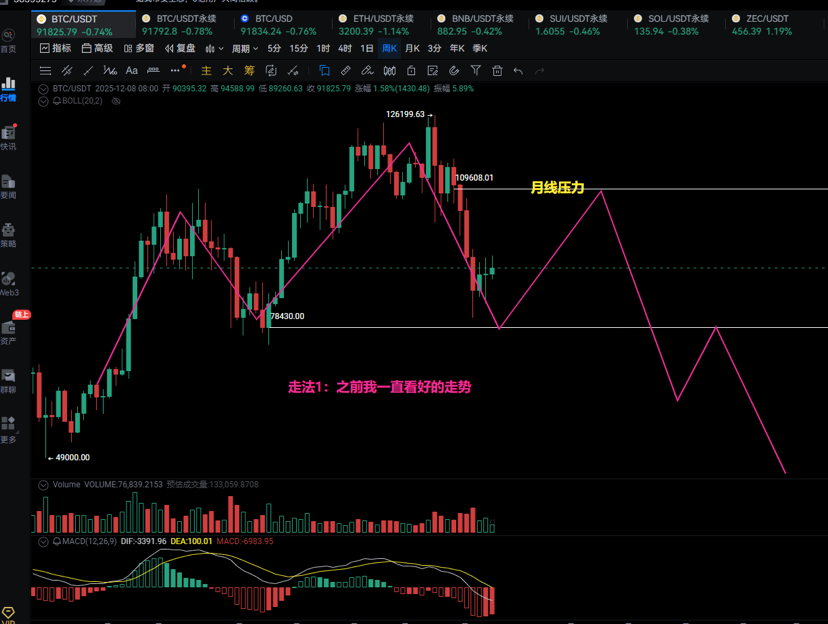
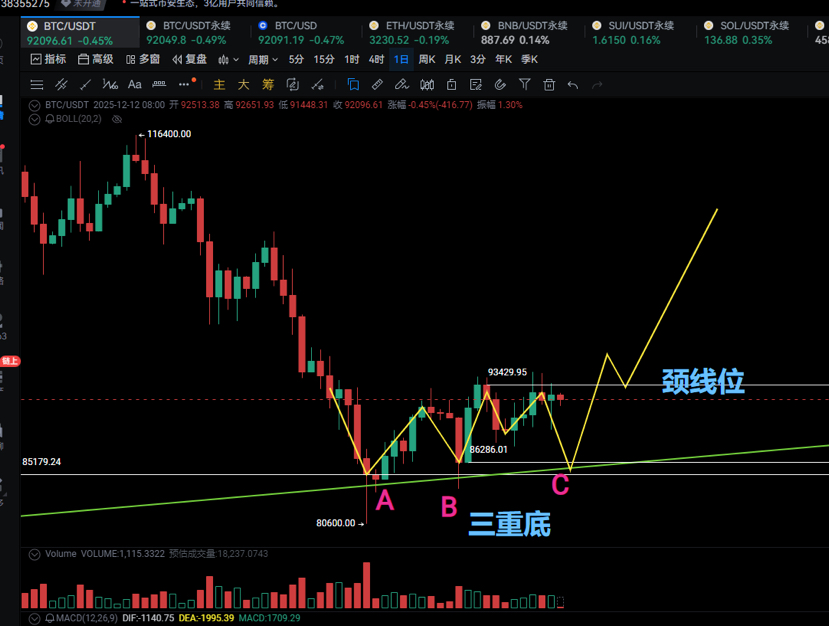
Three, daily line. After multiple tests of the weekly resistance at 94200, it couldn't break through. The day before yesterday was a shooting star, and just after the close, it was another variant of a hanging man. The trading volume slightly increased, indicating a volume expansion stagnation, which is bearish; therefore, a pullback is still necessary. The targets are 86300 and 85200. If it pulls back to these two levels again, I think the spot should at least increase to 50% of the position. When will the remaining 50% be sold? It will be when the daily line breaks through the neck line at 93429, or when it retraces to the neck line (not necessarily a retrace). Those who experienced the last bull market know that the second wave is swift and urgent, coming like a flash, and the time spent at the top is very short. You can review the last surge to 69000.