

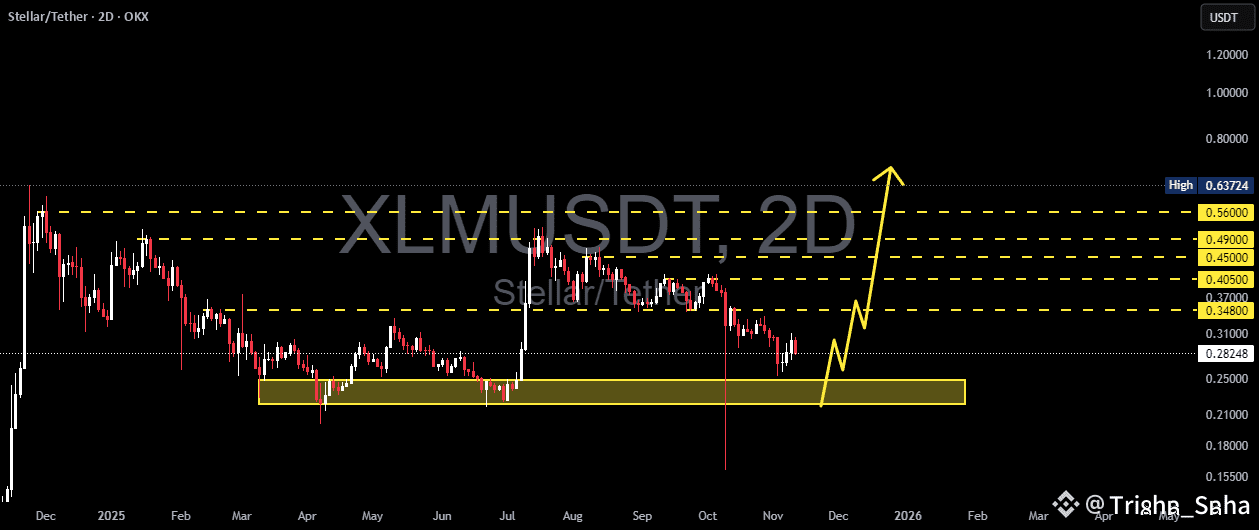
The XLM market is regaining attention after revisiting the golden zone at 0.248 – 0.220, an area that has repeatedly served as a strong foundation for buyers in recent months. The price reaction in this zone shows clear signs of sell-side absorption, visible through the emergence of long lower wicks, indicating sellers are losing momentum while buyers are quietly stepping in.
The medium-term structure remains bearish, characterized by a series of lower highs and lower lows. However, a potential technical reversal could unfold if the price manages to close a 2D candle above 0.32. This level acts as the psychological barrier separating a possible trend reversal from a mere corrective bounce.
If buying momentum continues, the layered resistance zones at 0.348 – 0.405 – 0.450 – 0.490 – 0.560 will serve as major checkpoints on the road to recovery. A breakout and consolidation above 0.405 could mark the formation of a new bullish structure.
Conversely, failure to hold the 0.248–0.220 support zone and a confirmed 2D close below 0.22 would strengthen the bearish continuation scenario, with potential downside targets toward 0.18 or even 0.155, where major accumulation may reappear.
---
Bullish Scenario:
Strong rebound from the 0.248–0.220 zone, forming a new higher low.
Main confirmation: 2D close above 0.32.
Step-by-step targets:
1. 0.348 (structure confirmation)
2. 0.405 (mid-term resistance)
3. 0.450–0.490 (distribution zone)
4. 0.560 (final short-term bullish target)
> A sustainable bullish structure forms only if buyers can hold above 0.348–0.37 for multiple consecutive 2D candles.
---
Bearish Scenario:
Breakdown below 0.220 with strong volume confirms sellers’ dominance.
Next targets: 0.18 and 0.155, where liquidity hunts and possible re-accumulation could occur.
This scenario remains valid unless the price reclaims 0.248 after a breakdown (failed reclaim = bearish confirmation).
---
Pattern:
The current setup resembles a “Descending Range with Accumulation Base”, where price continues to make lower highs but forms a flat base structure around 0.248–0.220.
Such formations often mark the early phase of a trend reversal when accompanied by increasing volume and a false breakdown (liquidity sweep).
If a break of structure occurs above 0.32, this could evolve into a Double Bottom Reversal Pattern.
---
Conclusion:
XLM is at a critical moment — the historical golden support zone is being tested once again.
Buyers have a solid chance to initiate a strong reversal, but without a confirmed close above 0.32, it could still turn out to be a dead cat bounce.
Aggressive traders may look to accumulate within the 0.248–0.220 zone with a tight stop below 0.215, while conservative traders should wait for a breakout confirmation above 0.32 to validate a potential trend reversal.


