$BTC Naked K-line view, directly hitting the essence; news can deceive, but K-lines do not.
1. Weekly chart. The M-top has broken, during the decline it encountered horizontal support and trend line support, stopped falling and rebounded. The pressure above is firstly horizontal, at 94261, and secondly the pressure from the green trend line. The rebound may reach the green trend line, but if it can't go up, it will ultimately test the 78430 support.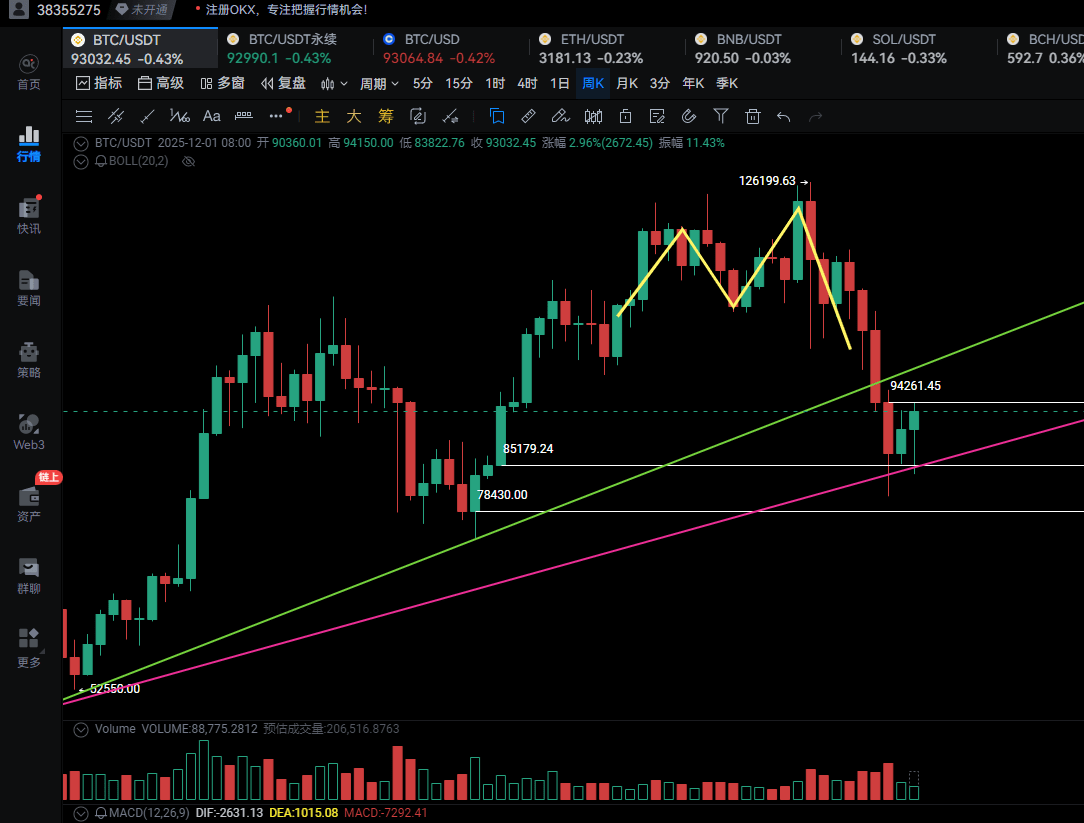
2. Daily chart. This needs to be discussed in detail. A double bottom structure has formed here, and it just broke through the neck line. The top-bottom structure is a reversal pattern. Is the trend reversing? I'm not optimistic! The reason is that the building cycle is too short, only a dozen candlesticks. The upper compound double top structure has taken three months, and this small double bottom has insufficient washout time, it feels more like an oversold rebound. I also reviewed it, this wave of daily level decline, the MACD fast line is already at an all-time low. Is it the end of the negatives and the beginning of the positives? At that time, I should have boldly taken a long position because I always saw the monthly line support at 82550. If I set a buy at 82000 or 81000, I could have caught this wave to 91500. Sometimes being overly cautious on the right side can also cause missed opportunities; a combination of both sides is still necessary.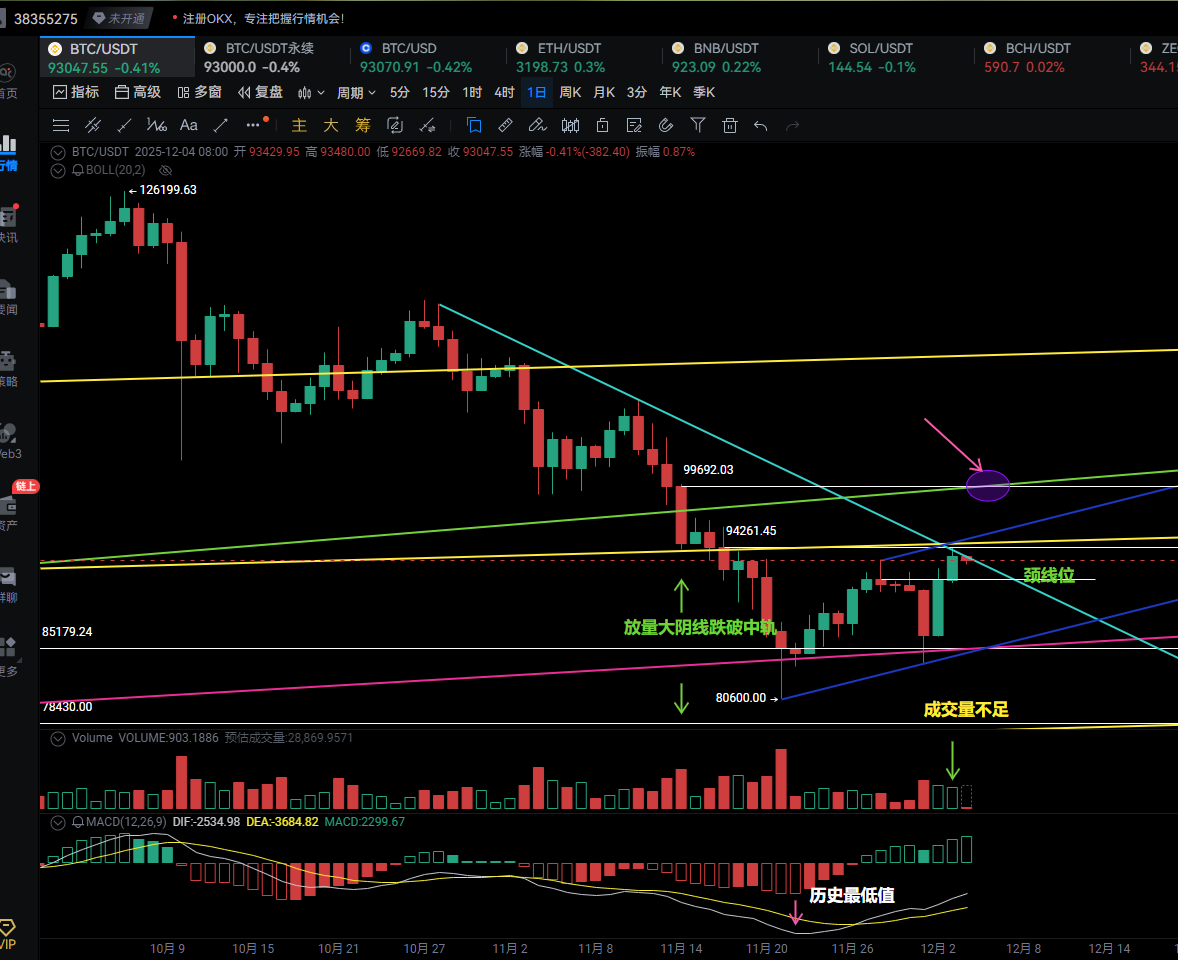
Can we short? The neck line has broken, and according to discipline, we should buy on dips, so we cannot short. Then should we go long? Not really! First, the daily line is barely a medium bullish close, passing, but the trading volume is shrinking, with no increase, so there is the suspicion of a false breakout; second, above is a point of quadruple resistance intersecting, with downtrend line resistance, channel midline resistance, weekly horizontal resistance, and flag upper boundary resistance. We don't go long at resistance points; this is also discipline. Do you see it? Sometimes it is only suitable to stay on the sidelines. Last night, I violated my discipline and shorted a BCH and got stopped out, so not controlling my hands is just giving away money.
Assuming this is a real breakout, today it has surged with volume again, how high can it go? It's at the point circled in the picture, where the horizontal resistance of 99692 intersects with the trendline resistance, and we will wait here to short. Where is the take profit for the short position? Around 85000, which is equivalent to a second test. If it can't hold at 85 here, it will test the weekly support at 78500, so this small double bottom may not necessarily be the final bottom.
3. 4-hour level. Continuous four or five K lines, but there is no large bullish line, and they all have long upper shadows, so the possibility of a false breakout that I mentioned when analyzing the daily line is quite high. There are many false breakouts in this market, how to identify them? Look at the K lines and then the trading volume; there are many details in this. Just looking at moving averages, Bollinger Bands, MACD, KDJ, and those things is useless. Remember, volume and price are fundamental.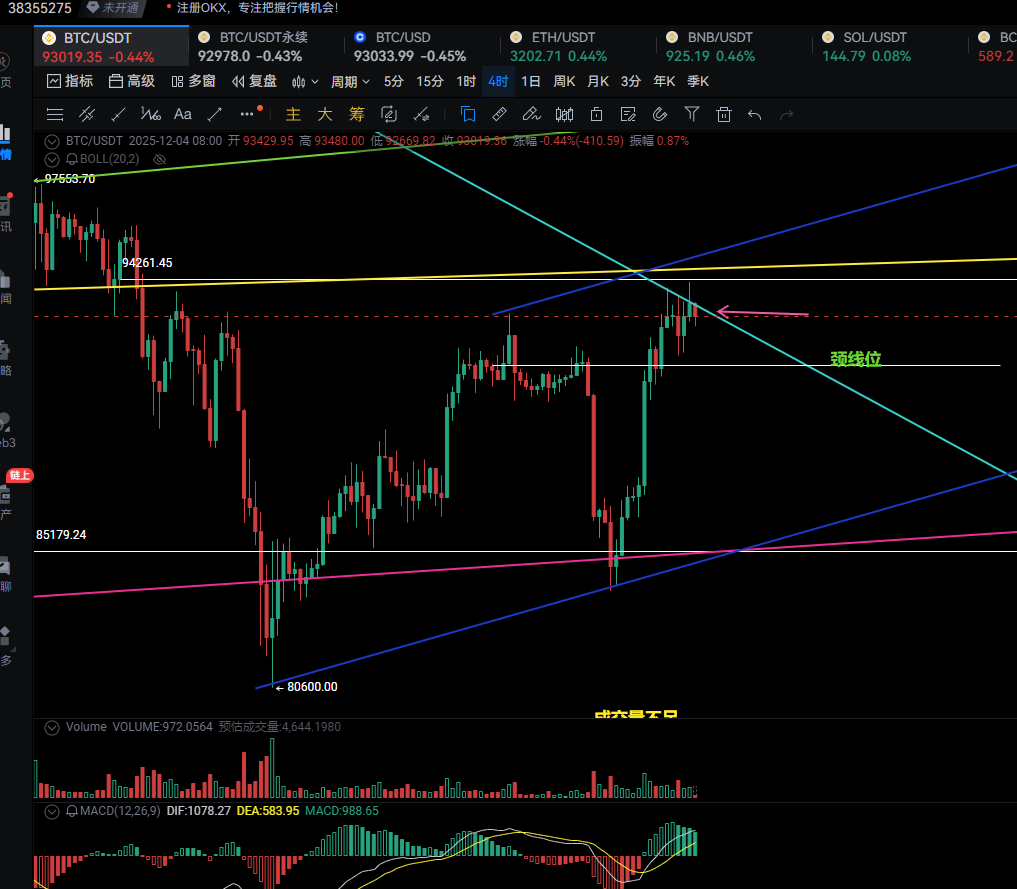
I am a naked K believer, simplicity is the ultimate sophistication, and naked K is king. Follow me, and every morning I will bring you an analysis of the market on time. I may not be able to make you money, but I can definitely help you lose less. The analysis of Bitcoin is like this, and I will write another one about eth.sol.bnb. Give me a like, so I have more motivation to create!


