Bitcoin's strength continues, but it's not advisable to chase long positions in the short term
Recently, Bitcoin continues to maintain a bullish pattern, but the current level is not suitable for blindly chasing long positions. The market shows obvious fluctuations, and Bitcoin is still in a critical neckline area, having neither broken upward nor shown a valid pullback. Therefore, the short-term direction is extremely tangled. Will it continue to form a daily-level W bottom, extending upwards to a long-term target of $107,000 to $113,000, or will it fall back after being blocked at the neckline? We need to wait for more signals to confirm.

Impact of macro data and market expectations
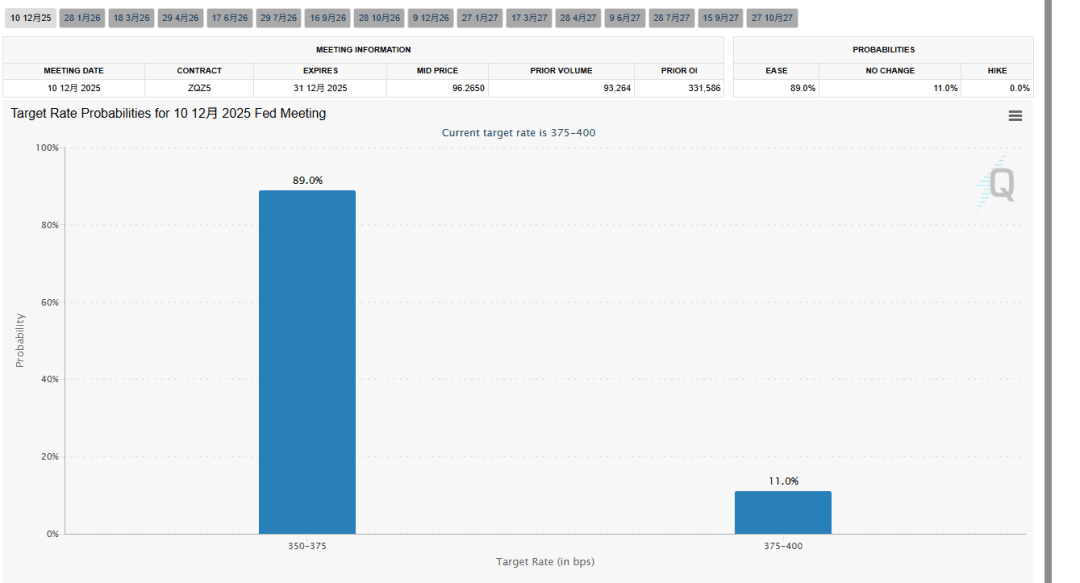
Yesterday's market showed signs of a pullback, but the U.S. employment index was significantly below expectations, reinforcing the market's expectation of a rate cut by the Federal Reserve in December, which increased the probability of a rate cut to 89%, stimulating Bitcoin's short-term stabilization.
However, despite the price rise, both the BTC spot and contract CVD buying are on a downward trend, while the funding rate remains persistently high. This 'price increase with weak volume + continuous long crowding' structure hides certain pullback risks, similar to the previous situation where prices struggled to rise while the funding rate was high.
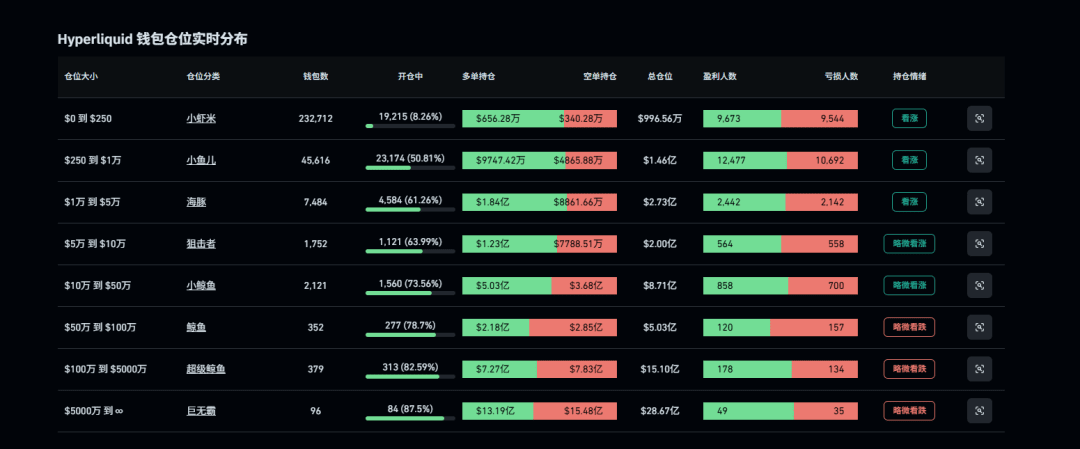
At the same time, large addresses (whales) are shifting from neutral to slightly bearish, and the outflow of BTC from exchanges is slowing down with some minor inflows, indicating a subtle change in funding sentiment.
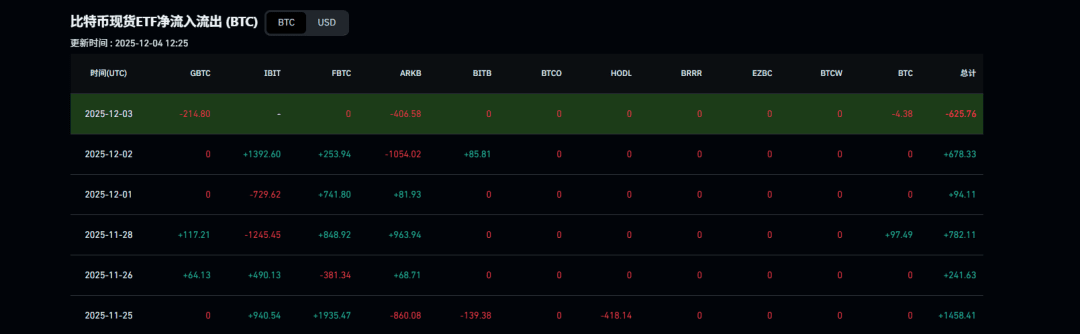
Moreover, Bitcoin ETF surprisingly saw a net outflow on the day the price rose, indicating insufficient spot buying strength, and further vigilance is needed for short-term structural risks.
Technical pressure is significant: the structure is unstable, and there is dense resistance above.
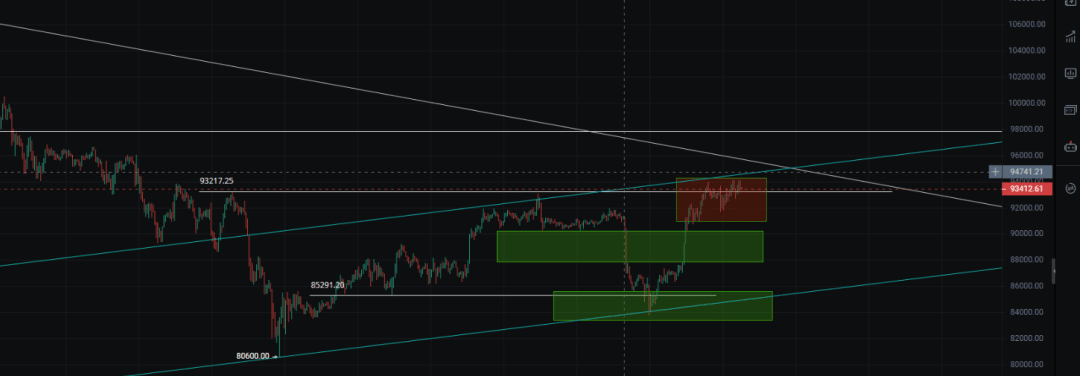
From the 4-hour level observation, although Bitcoin has formed a W bottom, the neckline has not yet been broken, and the rebound has always been suppressed by the Vegas channel, with multiple highs facing resistance.
This indicates that the market is not a false breakout, but clearly lacks momentum and has not formed a real trend reversal signal.
The 1-hour level shows a MACD divergence, with the price making new highs while the momentum bars are clearly diminishing, and multiple dead crosses have formed, which is a typical short-term topping signal that requires cautious response.
Three operational strategies: primarily waiting for pullbacks, do not chase highs.
(1) Pullback buy - the most robust plan.
The optimal strategy is to wait for a pullback in the key support range before positioning long orders, with the main areas including:
·$88,000–$89,000
·$84,000–$86,000 range
If signs of a bottoming out appear after the pullback, along with indicator reversals or structure recovery, this position will be a more reasonable entry point.
(2) Follow after a breakout, but must confirm the structure.
If the price strongly breaks through $98,000, it is not advisable to chase long positions immediately, as the dense left-side pressure area above can easily lead to a false breakout. Wait for a pullback to confirm support after the breakout, completing the 'pressure turns into support' (POC/stop-loss swap), and then enter long when support stabilizes; this way, the risk is more controllable.
(3) Lightly short, but do not be aggressive.
In the current neckline area, one can try short positions with a light load, but strict stop-loss is necessary, as the structure is weak but may still rebound. This is not the best shorting point; positions must be controlled to avoid being stopped out by a strong rise.
Ethereum has more potential: the structure has fully turned strong.
Compared to Bitcoin, Ethereum's performance is stronger. Its ETF saw a significant net inflow yesterday, returning to levels from a week ago, with funding significantly better than BTC.
From the daily structure, Ethereum has not only completed the neckline breakout of the W bottom pattern but also stands above the key stop-loss swap position, forming a typical strong reversal structure. At the same time, the downtrend line has also been effectively broken, satisfying all criteria of the ABC and 1-2-3 reversal rules, confirming the establishment of a trend reversal.
The best pullback buying points in the short term include:
·Around $3,100 (previous structural support)
·$2,900–$3,000 range (0.382–0.5 golden retracement + gap resonance area)
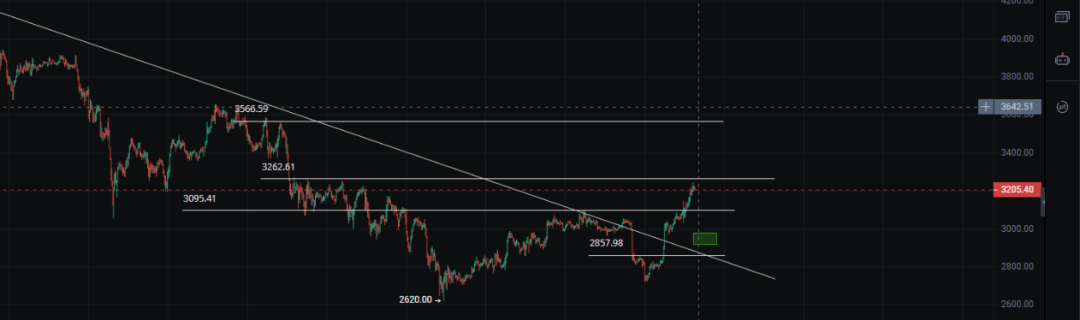
If the price first breaks above the parallel top and forms a false breakout, one can short in the short term, waiting for a pullback to the above range before entering long.
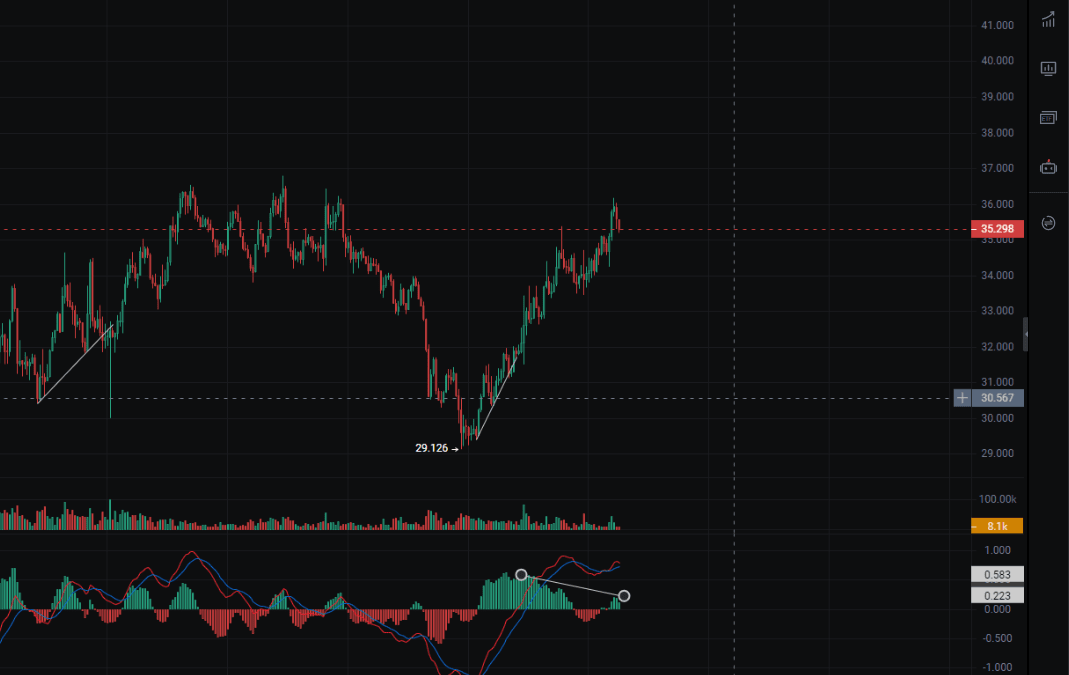
Altcoin sentiment: HYPE has shown topping signals.
Some ecological tokens like Hype have shown significant topping divergences, with prices near parallel highs accompanied by MACD momentum exhaustion. If a resonance pullback occurs simultaneously with Bitcoin and Ethereum, it provides a short-term short opportunity. However, it is important to note that such coins have higher volatility, and position and risk management are more critical.
Overall view: the primary upward trend remains unchanged, but caution is necessary in the short term.
Comprehensive analysis:
·The BTC bullish trend is still present, but short-term momentum is insufficient, and risks are elevated, making it unsuitable to chase highs.
·ETH is stronger than BTC, the structure has clearly turned bullish, and it deserves more attention after a pullback.
·The short-term focus is on waiting for pullbacks, do not chase orders in resistance areas.
·There is dense pressure above, and position management is more important than direction.


