
Current BTC spot and contract markets are showing a high-level consolidation with reduced volume. Prices are oscillating in a narrow range below the key MA200 and cost line, with the Bollinger Bands indicating prices are close to the upper band, but trading volume has drastically shrunk, and contract trading volume has plummeted, indicating market liquidity exhaustion. Both bulls and bears are in a wait-and-see mode, with no clear trend, rather a typical oscillation pattern before a change.
Key prices and range structure
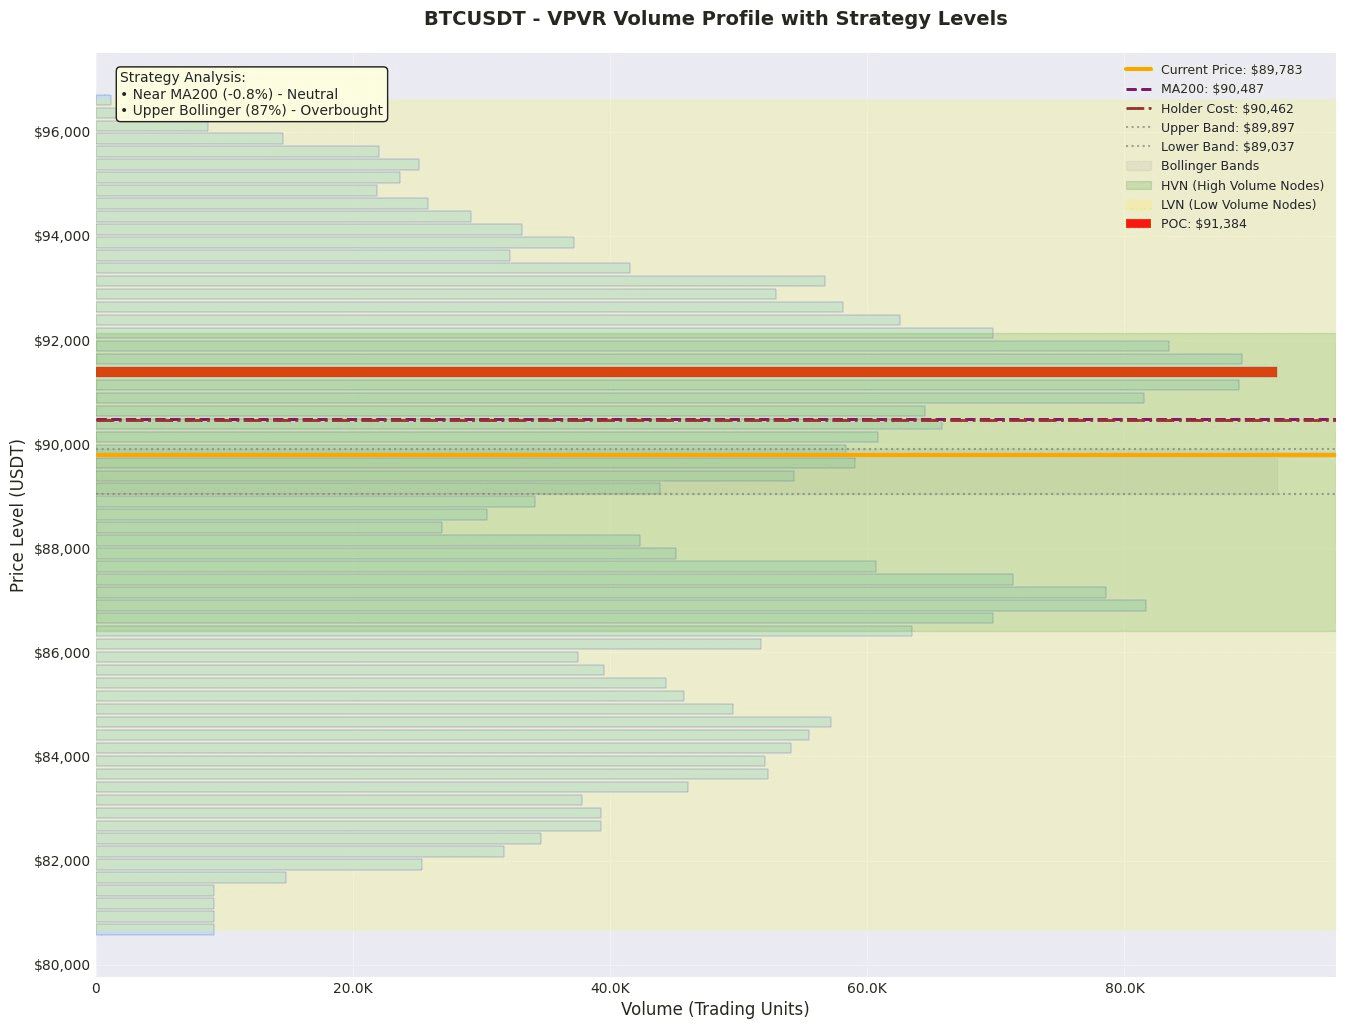
1. Value Anchoring Zone: According to VPVR data, the current market's value anchoring zone (Value Area) is 83416 - 93126, with POC (Point of Control) at 91383. The current price of 89783 is below the POC, situated in the lower middle part of the value zone. POC (91383) will be an important resistance level for price rebound tests, while the lower edge of the value zone at 83416 is a key support for the medium to long term.
2. Trend and Volatility Range: The current price of 89783 is slightly below MA200 (90486) and the average holding cost (90461), indicating that the price is facing critical suppression from the medium to long-term trend line. The Bollinger Bands range is 89037 - 89897, with the current price at the 86.7th percentile, close to the upper band, indicating short-term technical overbought pullback pressure. 89000 (near the middle band of Bollinger Bands) is an important intraday support recently.
3. High Transaction Volume/High Volume Nodes (HVN): According to market data, the main buying pressure is concentrated at 89000 (1.241 million USDT) and 89590 (1.231 million USDT), forming a dense support zone below. The main selling pressure is concentrated at 89812 (733,000 USDT) and 90500 (528,000 USDT), with 90500 overlapping with the MA200 position, forming a strong resistance zone above.
Derivatives and Liquidity Analysis
• Leverage and Long/Short Tendencies: The funding rate is positive but extremely low (0.00002857), and the long/short ratio has slightly risen from 2.1476 to 2.1856, indicating that market sentiment is slightly bullish but not overheated, with no extreme crowding.
• Liquidity Signal: The change in contract transaction volume is -98.7%, resulting in a sharp decline, while open interest (OI) remains high at 7864.45M, with an unusually high OI/market value ratio (34111710.56%). This constitutes a typical signal of 'decreasing volume and stable price, high positions' liquidity exhaustion, usually indicating upcoming severe fluctuations.
• Operational Advice: In this environment, the risk of high-leverage trading is extremely high. Insufficient market liquidity may lead to 'spikes' or rapid slippage at key price points. It is recommended that investors reduce their positions, avoid using high leverage, and focus on wait-and-see or small-position range operations, waiting for an increase in transaction volume and clear direction before making decisions.
News and Event Impact
Currently, there are no major news events. The market is primarily driven by technical factors and derivatives capital competition.
Trading Strategy
Plan A: Conservative Range Trading (Sell High Buy Low)
• Direction: Range oscillation operation.
• Entry Range: Lightly test long positions in the lower support area of 89500-89000 (combined with the dense buying area); lightly test short positions in the upper resistance area of 90400-90800 (MA200 and selling area).
• Stop-Loss Level: Set stop-loss for long positions at 88900 (below the lower band of Bollinger Bands); set stop-loss for short positions at 91300 (above POC).
• Target Level: For long positions, aim for 90200 (near MA200); for short positions, aim for 89200 (middle band of Bollinger Bands).
• Expected Profit and Loss Ratio: Taking long positions as an example, entry at 89500, stop-loss at 88900 (loss of 600 points), target at 90200 (profit of 700 points), the profit-loss ratio is approximately 1.17.
Plan B: Aggressive Breakout Follow (Right-Side Trading)
• Direction: Wait for directional breakout and follow the trend.
• Entry Conditions: If the price increases in volume (transaction volume recovers to above the 24-hour average) and stabilizes above 90500 (MA200 and selling pressure area), consider chasing long; if the price increases in volume and falls below 88900 (key buying support and lower band of Bollinger Bands), consider chasing short.
• Stop-Loss Level: Set stop-loss for long positions below 90000; set stop-loss for short positions above 89500.
• Target Level: For long positions, the first target is 91380 (POC), the second target is 93126 (upper edge of the value area); for short positions, the first target is 88500, the second target is 87500.
• Expected Profit and Loss Ratio: Taking upward breakout long positions as an example, entry at 90600, stop-loss at 90000 (loss of 600 points), first target at 91380 (profit of 780 points), the profit-loss ratio is approximately 1.3.
Risk Warning and Position Management
1. Extreme Liquidity Risk: Contract transaction volume has plummeted by 98.7%, while OI remains high, which is the most alarming signal. Once large orders appear, the market may experience price fluctuations far beyond expectations due to insufficient liquidity, easily triggering stop-loss.
2. Key Level Game Risk: The price is close to the upper band of Bollinger Bands and below MA200, at a strong technical suppression level. The buying and selling pressure ratio shows slightly stronger buying (1.27x), but the main selling unit at 90500 overlaps with MA200, and a failed breakout may trigger a rapid pullback.
3. Position and Risk Control Recommendations:
• The current environment is absolutely unsuitable for using high leverage. It is recommended to control the total position within 10% of the account capital.
• Use a phased position building strategy; the initial position for any strategy should not exceed 50% of the planned total position.
• If contract transaction volume continues to be low or the price repeatedly tests key levels (such as 90500 or 88900) without effective breakouts, trading should be paused, and a wait-and-see approach should be maintained. Once a breakout or breakdown occurs, follow the right-side strategy with light positions.
Like and follow for real-time updates!
$BTC
