
USTC is currently in a strong one-sided upward trend, with prices soaring over 50% within 24 hours, accompanied by a sharp increase in trading volume to 3.5 times the average, leading to extremely exuberant market sentiment. However, the futures market shows a negative funding rate, indicating that shorts are paying longs, suggesting that the rapid short-term increase may trigger a correction, and the market is in a state of greed intertwined with potential adjustments.
Key price and range structure
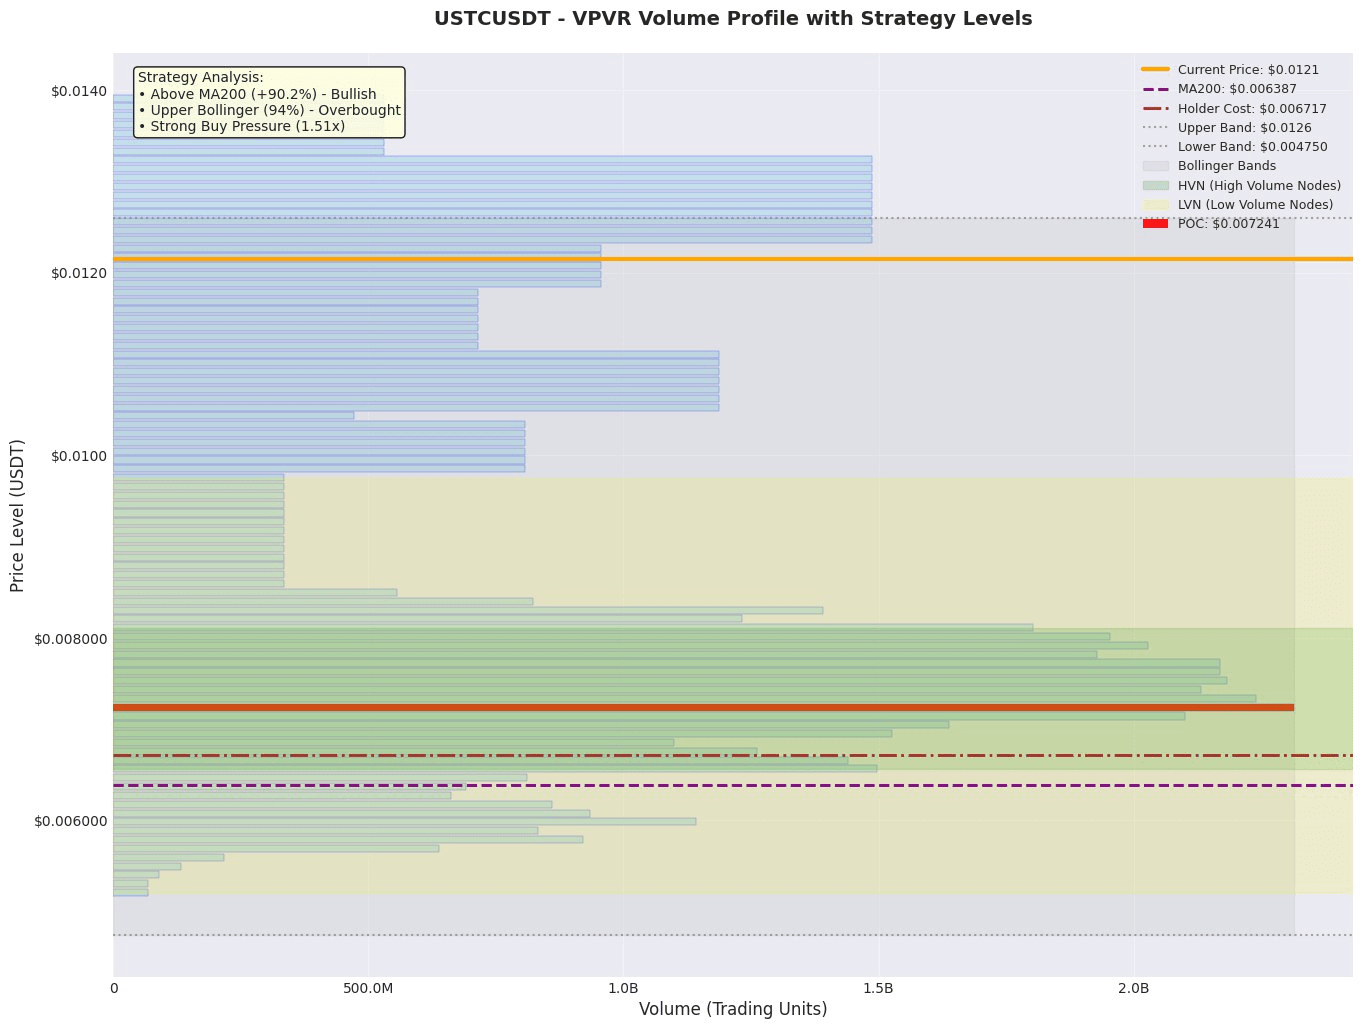
1. Value anchoring area: VPVR data shows that the POC (Point of Control) is at 0.00724, and the Value Area ranges from 0.00598 to 0.01324. The current price of 0.01215 is near the upper end of the value area (VAH=0.01324), and this position will form significant resistance. The POC (0.00724) serves as key support below and a 'value anchor,' attracting buying interest if the price corrects.
2. Trend and Volatility Range: The price is significantly above MA200 (0.00639) by about 90.2%, confirming a strong long-term upward trend. The upper Bollinger Band is at 0.01259, and the current price is at the 94.3% percentile of the Bollinger Band, extremely close to the upper band, with strong overbought and pullback pressure on the technical front. The middle and lower Bollinger Bands (approximately 0.00867 and 0.00475) constitute potential support for subsequent pullbacks.
3. High Trading Volume/High-Volume Nodes (HVN): The area around 0.00724 where POC is located is a core HVN, an important support/resistance transition zone. Additionally, the upper and lower bounds of the value range (0.00598 and 0.01324) are also relatively concentrated areas for trading volume, where prices are likely to pause or reverse when touching these positions.
Derivatives and Liquidity Analysis
• Leverage Fund Bias: The funding rate is negative (-0.00046462), indicating that despite the surge in spot prices, there are more short positions than long positions in the contract market, with shorts needing to pay fees. The long-short ratio dropped from 1.23 to 1.01, showing that long advantages are quickly fading, and short forces are starting to gather at high prices. This usually means that the chase-up sentiment in the derivatives market is not enthusiastic, and there may even be bearish leveraged bets.
• Liquidity Status: Contract trading volume surged by 558.3%, while open interest (OI) reached 10.45M USDT, with an OI/market cap ratio as high as 15.15%. This indicates that a large amount of new capital (especially leveraged capital) is pouring into the market for speculation, with ample liquidity but extremely high volatility. Currently, there are no signals of trading volume plummeting or OI sharply declining, indicating no liquidity exhaustion.
• Leverage and Position Advice: The current market leverage funds are active, and the long-short divergence is increasing. The high-volatility environment is not suitable for amplifying leverage. It is recommended that investors reduce positions and avoid using high leverage, as prices are at critical technical resistance levels (Bollinger Band upper band), making them susceptible to sharp pullbacks due to profit-taking or short attacks.
News and Events Impact
Currently, there are no significant news events. The surge at USTC is primarily driven by market sentiment and capital, possibly related to the broader rotation of Meme coins or small-cap altcoins.
Trading Strategy
Plan One: Aggressive Pullback Long (Bet on Trend Continuation)
• Direction: Long
• Entry Range: Price pulls back to the upper side of the VPVR value range (VAH) or near POC support, specifically in the range of 0.01150 - 0.00780, can be built in batches. Pay close attention to the price's first reaction near 0.00724 (POC).
• Stop Loss: Set below the low point of the entry candlestick or outside the nearest significant HVN (e.g., 0.00598, VAL), such as 0.00550.
• Target Price: The first target looks towards the previous high near the upper Bollinger Band at 0.01260; the second target looks towards the main sell zone above at 0.078 (but this is a long-term target, requiring trend continuation).
• Expected Risk-Reward Ratio: Based on entry at 0.00800, stop loss at 0.00550, target at 0.01260, risk 0.0025, profit 0.0046, the risk-reward ratio is approximately 1.84.
Plan Two: Conservative Rebound Short (Bet on Technical Pullback)
• Direction: Short (Short-term)
• Entry Range: Price stagnates near the upper Bollinger Band (currently around 0.01260) or VAH (0.01324), forming a bearish candlestick pattern (e.g., long upper shadow, engulfing).
• Stop Loss: Set above the high point of the entry candlestick, for example, 0.01350.
• Target Price: The first target looks towards the middle Bollinger Band at 0.00870; the second target looks towards POC support at 0.00724.
• Expected Risk-Reward Ratio: Based on entry at 0.01280, stop loss at 0.01350, target at 0.00870, risk 0.0007, profit 0.0041, the risk-reward ratio is approximately 5.86 (but this is a counter-trend trade, with a lower success rate).
Risk Warning and Position Management
1. Overbought and Crowding Risk: The price is at the 94.3% percentile of the Bollinger Band, technical indicators are severely overbought, and it is close to the upper strong resistance, with extremely high short-term pullback risk.
2. Derivative Long-Short Reversal Risk: Negative funding rates and high OI/market cap ratio (15.15%) indicate that leveraged shorts are accumulating. Once the price starts to decline, it may trigger a chain reaction of long liquidations and short additions, exacerbating the downside.
3. Liquidity Volatility Risk: Contract trading volume surged by 558.3%, and while current liquidity is sufficient, such a huge increase is unsustainable, and caution is needed for the volatility amplification and slippage risks brought by a sudden drop in trading volume.
• Position Management Advice:
• High leverage is strictly prohibited in the current environment. It is recommended that total position risk exposure does not exceed 5% of account principal.
• Adopt a batch building strategy, especially in the long strategy of Plan One, where entry should be split into 2-3 times in support areas to reduce the average price.
• If observing a sudden drop in contract trading volume exceeding 50% (relative to recent highs) or if funding rates turn positive with rapid expansion, it should be regarded as a market sentiment reversal signal, and positions should be reduced or exit to observe.
Like and follow for real-time updates!
$USTC
