
The current ZEC spot and contract market shows a fluctuating and slightly strong pattern. The spot price is running between the lower Bollinger band and is below MA200 and the holding cost, indicating that the medium to long-term trend remains weak. However, the 24-hour trading volume has significantly increased to 2.0 times the average, and the buy-sell pressure ratio shows greater buying pressure. Combined with a slight price increase, this suggests a strong willingness to support the market below, indicating that it is not a unidirectional downward trend but rather in a stage of seeking direction and accumulating momentum.
Key prices and range structure
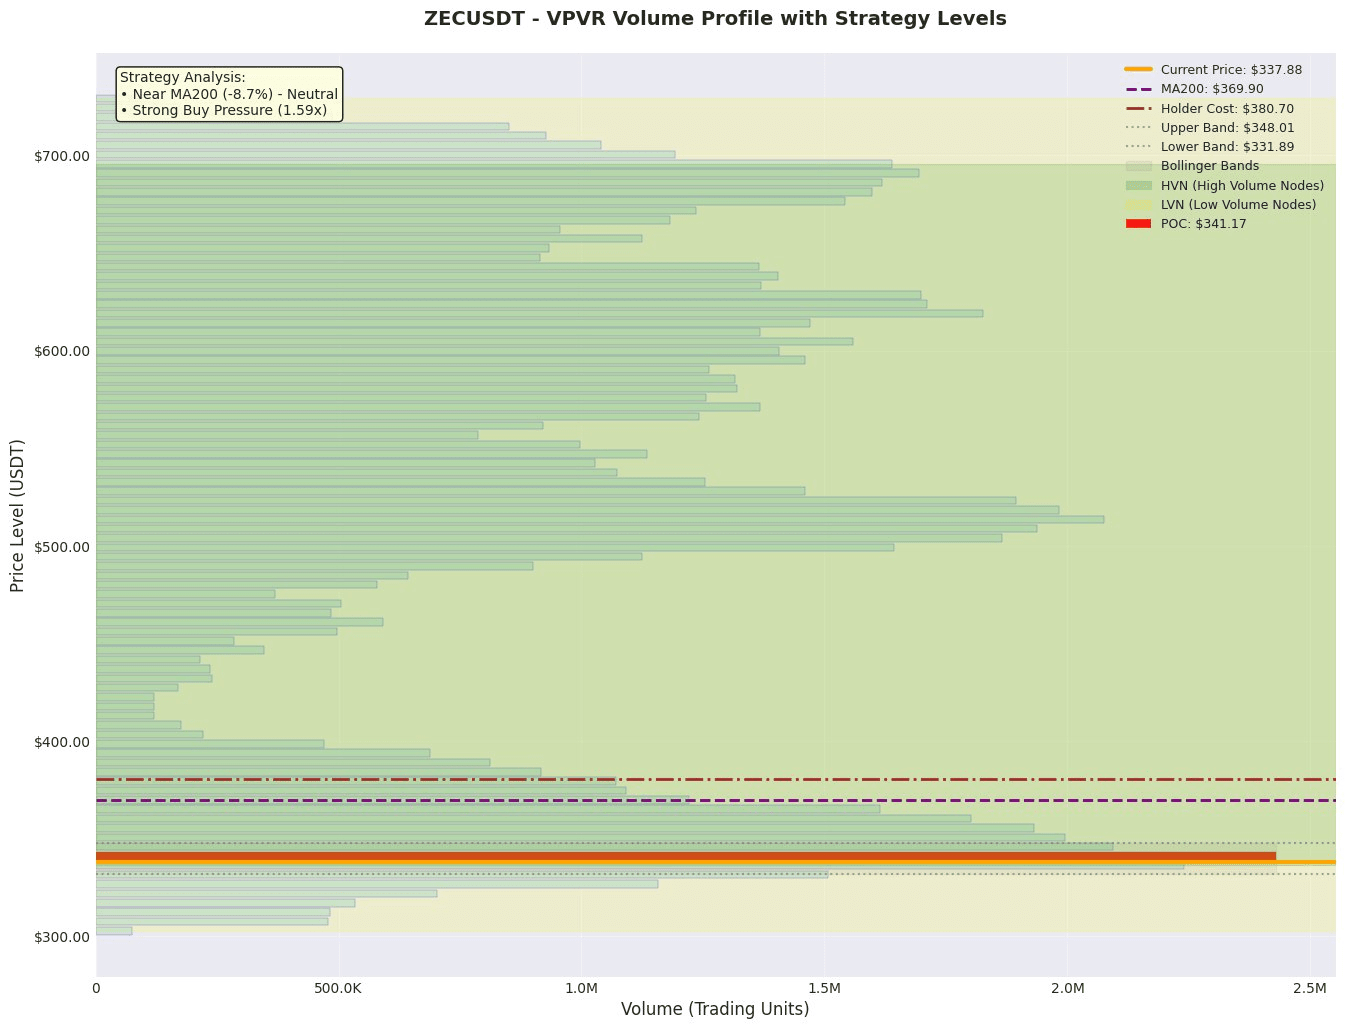
1. Value anchoring area: According to VPVR data, the current value anchoring area (POC) is at 341.17, which is the core price point of recent games. The range of the value area is extremely wide, from 326.80 to 700.43, with the lower edge at 326.80 being an important support reference, while the upper edge at 700.43 is too far from the current price to be meaningful for analysis. The current price of 337.88 is slightly below the POC, and if the price can stabilize above the POC, it will help shift market sentiment to a positive one.
2. Trend and Volatility Range: The current price of 337.88 is approximately 8.7% below the MA200 (369.90), positioned below the medium to long-term moving averages, with an overall bearish trend. The price is at the 37.2% percentile of the Bollinger Band (331.89 - 348.01), in the weaker region of the lower half. The upper Bollinger Band at 348.01 is an important short-term resistance level; if it can be effectively broken, it may launch an attack towards the MA200.
3. High Trading Volume/Value Concentration Area (HVN): The data does not provide specific HVN price levels. However, the main buying positions (200.0, 319.0) and selling positions (400.0, 500.0) can be viewed as potential value concentration areas. There are significant buy orders near 319.0, forming strong support below; while 400.0 and 500.0 create notable resistance areas above.
Derivatives and Liquidity Analysis
• Leverage Capital Sentiment: The current funding rate is a small positive number (0.0001), indicating that the perpetual contract market's long and short forces are temporarily balanced, with bulls slightly ahead but not overcrowded. The long-short ratio has risen from 1.1142 to 1.1602, showing an increase in bullish confidence.
• Liquidity Status: Open interest (OI) is as high as $226.68 million, and the OI/market value ratio reaches an astonishing 559.15%, indicating that the market leverage is extremely high, and price fluctuations can easily be amplified. The change in contract trading volume is +93.5%, indicating that trading activity is very active, and there are no signs of liquidity exhaustion.
• Leverage Advice: Given the extremely high OI/market value ratio, the market is in a high leverage, high risk, and fragile state. Any drastic price fluctuations in either direction may trigger a chain liquidation. Therefore, it is absolutely unsuitable to amplify leverage, and traders should adopt a conservative strategy, strictly controlling positions, primarily focusing on observation or light position attempts.
News and Events Impact
• No significant news events currently.
Trading Strategy
Plan One: Conservative Pullback Long Strategy
• Direction: Long
• Entry Range: Wait for the price to pull back to near the lower Bollinger Band at 331.89, or the lower edge of the VPVR value area at 326.80, and show a reversal candlestick pattern (such as a long lower shadow).
• Stop Loss: Set below the low of the entry candlestick, or below key support at 319.0, for example 315.00.
• Target: First target at the upper Bollinger Band 348.01, second target at the POC and the recent resistance at the upper edge of the 341.17-348.01 range.
• Expected Risk-Reward Ratio: Based on entry at 333.00, stop loss at 315.00, and target at 348.00, the risk-reward ratio is approximately (348-333)/(333-315) = 15/18 ≈ 0.83.
Plan Two: Aggressive Breakout Long Strategy
• Direction: Long
• Entry Range: If the price breaks above the upper Bollinger Band at 348.01 with increased volume (trading volume consistently above the average) and holds, it can be considered a breakout signal.
• Stop Loss: Set below the low of the breakout candlestick or below the middle Bollinger Band, for example 343.00.
• Target: First target at the MA200 moving average 369.90, second target at the major selling positions 400.00.
• Expected Risk-Reward Ratio: Based on entry at 350.00, stop loss at 343.00, and target at 370.00, the risk-reward ratio is approximately (370-350)/(350-343) = 20/7 ≈ 2.86.
Risk Warning and Position Management
1. High Leverage Risk: OI/Market Value ratio as high as 559.15%, the overall market leverage is extremely high, and prices are prone to extreme volatility and spike events.
2. Liquidity Reversal Risk: Although the current trading volume is increasing, if the trading volume shrinks later, it may not support price increases, leading to a failed breakout.
3. Strong Resistance Risk Above: There are large sell orders at the 400.0 and 500.0 price levels, which are solid resistance areas, and rebounds may end here.
Position Management Advice:
• Strictly prohibit high leverage: Given the extremely high market leverage, it is recommended to use low leverage or spot trading.
• Gradual Position Building: If using Plan One, consider building positions in batches near support levels rather than a full position at once.
• Strict Risk Control: Total position risk exposure should not exceed 1%-2% of the account principal. If the price falls below key support (such as 319.0), or if there are adverse signals such as a drastic drop in contract trading volume or a negative funding rate, immediate stop loss or reduction of position should be considered.
Like and follow for real-time updates!
$ZEC
