# Analysis of the trading pair PIEVERSE-USDT
Time period: 2025-12-07 17:45:00 ~ 2025-12-08 04:45:00
Nature of the data: Real-time data
## Analysis of Japanese Candlestick Patterns
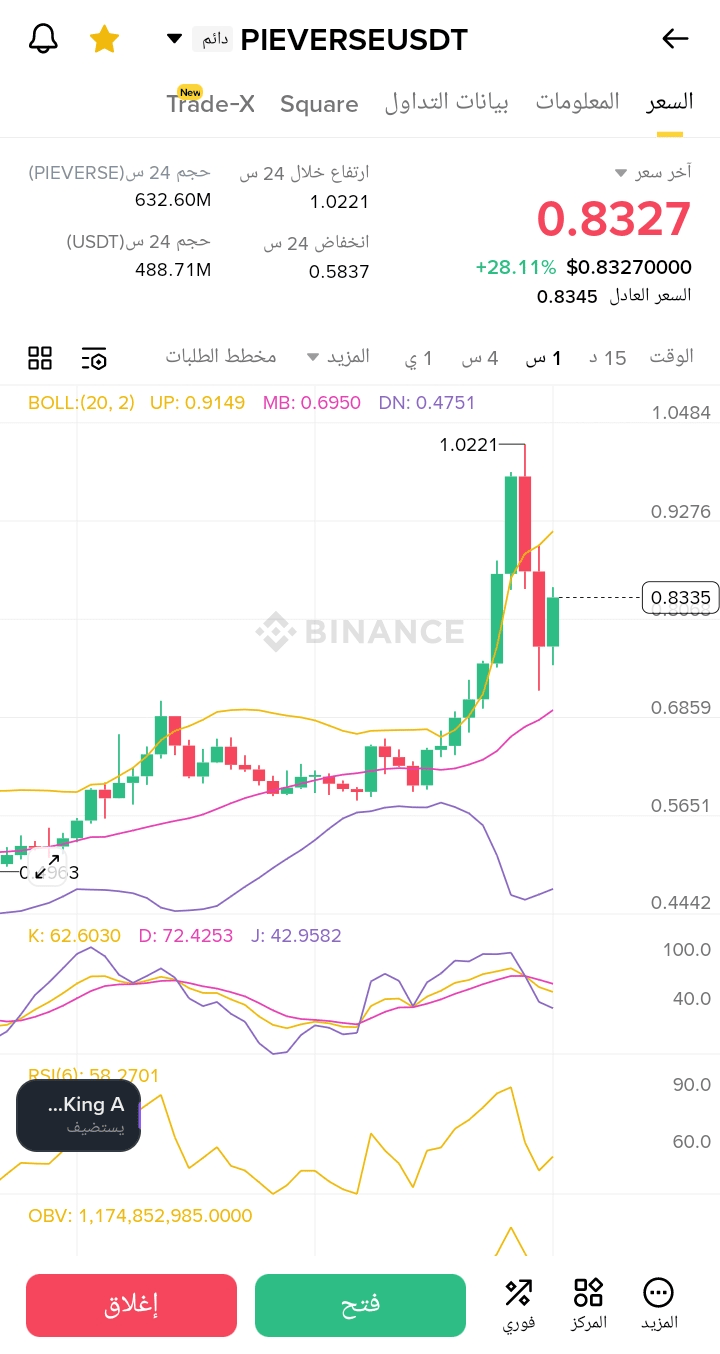
*[Around 12-07 16:30]** Appearance of a Doji candlestick pattern at approximately 0.65 - a signal of market indecision and uncertainty - medium strength signal
*[Around 12-07 20:15]** A strong upward pattern forms with a series of consecutive green candles reaching 1.02 - strong upward momentum - strong signal
*[After the rise]** A bearish reversal pattern appears with a long red candle at 1.02 - exhaustion of bullish momentum - strong signal
*[Around 12-07 22:00]** A double bottom pattern forms at approximately 0.75 - effective support and potential rebound start - strong signal
*[Last Candles]** A green candle with a long lower shadow appears at 0.83 - effective support and continuation of the bullish trend - strong signal
## Analysis of Support and Resistance Levels
Support Levels:
* First Strong Support: 0.75 (double bottom area)
* Medium Support: 0.80 (intensive trading area)
* Lowest Support: 0.65 (previous accumulation area)
Resistance Levels:
* First Resistance: 0.85 (previous correction area)
* Medium Resistance: 0.96 (previous tested level)
* Strong Resistance: 1.02 (previous peak)
## Overall Technical Evaluation
*Volume and Price Coordination**: A noticeable increase in trading volumes during the strong rise, confirming the strength of the bullish trend. A rise in trading volumes is also observed during the correction period, followed by a resumption of the rise with good trading volumes.
*General Market Trend**: After a strong rise to 1.02, the price experienced a downward correction and then regained strength, stabilizing around 0.83, indicating that the overall trend remains bullish despite the correction.
*Summary of Technical Signals**:
- Positive Signals: Double bottom pattern, recent green candles with lower shadows, a rise of 27.10% over 24 hours
- Negative Signals: Recent correction from level 1.02
## Conclusion
The PIEVERSE-USDT pair shows a clear bullish pattern with a temporary correction. Traders can consider buying at the specified support levels while placing stop-loss orders below the 0.75 level. The resistance level of 0.85 should be monitored as a near target, and if broken, the rise may continue towards 0.96.
Risk Warning: Despite the positive signals, caution is advised due to the significant rise of 27.10% over 24 hours, which could lead to a deeper correction. Risk management is recommended, and do not invest more than you can afford to lose.