
Sell order for targets
First 0.4340
Second 0.4215
Third 0.4080
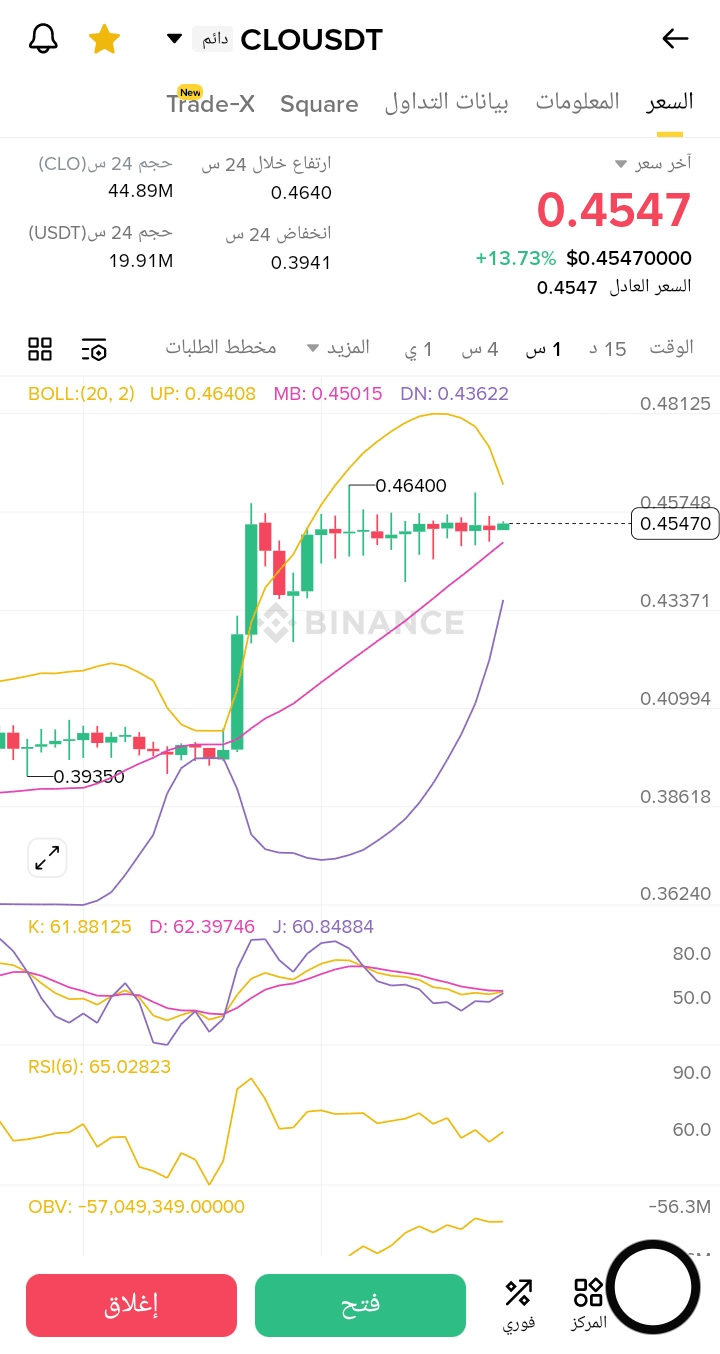
# Analysis of the CLO-USDT pair
## Timeframe: 2025-12-07 18:00:00 ~ 2025-12-08 05:00:00
## Nature of the data: Real-time data
## Analysis of candlestick patterns
*In the middle of the chart around price 0.44150** a long red candle pattern appeared - Strong selling pressure signal - Strong signal
*Near price 0.43826** a swing bottom pattern appeared - exhaustion of the downtrend - medium strength signal
*Around price 0.45924** a long green candle appeared - strong buying pressure - strong signal
*On the last chart at 0.45431** a Doji pattern appeared - market indecision and balance between sellers and buyers - neutral signal
## Technical Indicators Analysis
*Volume Indicator (VOL)**: Shows an increase in trading volume at key reversal points, especially at price 0.43826 and at price 0.45924, supporting the validity of the reversal.
## Identifying Support and Resistance Levels
*Support Levels**:
- Strong Support: 0.43800
- Medium Support: 0.44150
- Near Support: 0.45000
*Resistance Levels**:
- Near Resistance: 0.45500
- Medium Resistance: 0.46000
- Strong Resistance: 0.46250
## Overall Technical Assessment
*Volume and Price Coordination**: Shows a good correlation between price increases and increased trading volumes, indicating strength in the bullish trend.
*Overall Market Trend**: Short-term bullish trend after forming a bottom at 0.43826, with a 13.70% increase in the last 24 hours.
*Price Fluctuation**: The price moves within a trading range between 0.44150 and 0.46249, with a gradual upward trend.
## Summary and Suggestions
The CLO-USDT pair shows clear bullish strength after forming a bottom at 0.43826. The increase of 13.70% over 24 hours reflects strong positive momentum. The price currently appears to test a nearby resistance level at 0.45500, and may experience some short-term correction.
### Operational Suggestions:
* For short-term traders: Consider buying on the bounce from support levels 0.45000 or 0.44150 with a stop loss below 0.43800.
* For medium-term investors: Monitor the breakout of level 0.46000 to confirm the continuation of the bullish trend.
### Risk Warnings:
* The price may experience a correction after the recent strong rise.