
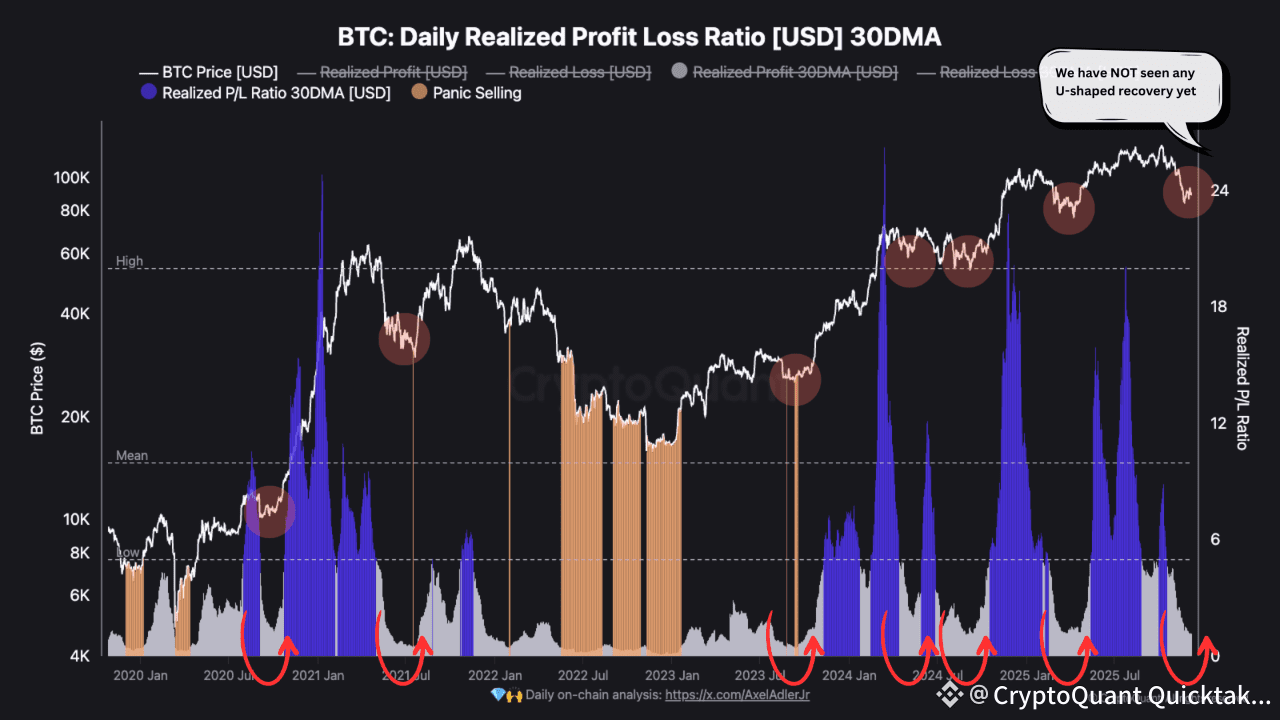
Looking at the Daily Realized Profit Loss Ratio (30d DMA), the answer is direct: we're still in bottom formation territory. When you use this indicator in isolation, it's accurate at showing where bottoms and tops position themselves. Right now? We haven't started the recovery yet.
👉 What does that mean?
A few things can still happen here, and not all of them are immediately bullish.
We haven't started our recovery yet. The first meaningful blue bar should signal a real shift in market structure, and we're not seeing that strength materialize. We can stay in this bottom formation longer than most expect. Consolidation takes time. This phase could extend for weeks, even if price doesn't drop much further.
The worst might not be over yet. But this doesn't feel like panic selling. No capitulation, no desperation in the on-chain data. Just time passing and consolidation building. That's actually a healthy sign for what comes next.
⚠️ But what about the risk?
Yes, problems can occur along the way. This isn't a mechanical rule where bottom formation automatically equals upside. If we take this indicator in isolation, nothing guarantees we go up from here.
But when I match this with other macro components like global liquidity and the ISM cycle, my bias leans up. This consolidation pattern is healthy.
💬 Should you buy the dip?
I don't personally run that strategy at the moment. But historically, every bottom of the U-shape pattern on this indicator marked a solid entry point.
Are we at the bottom right now? I'll leave that to your interpretation. I'm here to show you how to read indicators smoothly, not to prescribe entries.
Worth noting: we haven't seen a panic selling zone yet. It's not compulsory to see one, but we're still very oversold either way.
📊 The takeaway
We're not in recovery mode yet. We're building the foundation for it through time and consolidation.
Watch the 30d DMA. When it starts curving up, that's your signal. Not before.
Written by RugaResearch

