
DASH is currently in a weak oscillating bottoming phase. The spot price has fallen below the MA200 and the market average holding cost, with a weak technical outlook; however, order book data shows significant buying pressure, indicating a short-term technical rebound demand. Contract market trading volume has sharply shrunk, with market trading willingness being low, and overall sentiment leaning towards cautious observation.
Key Price and Range Structure
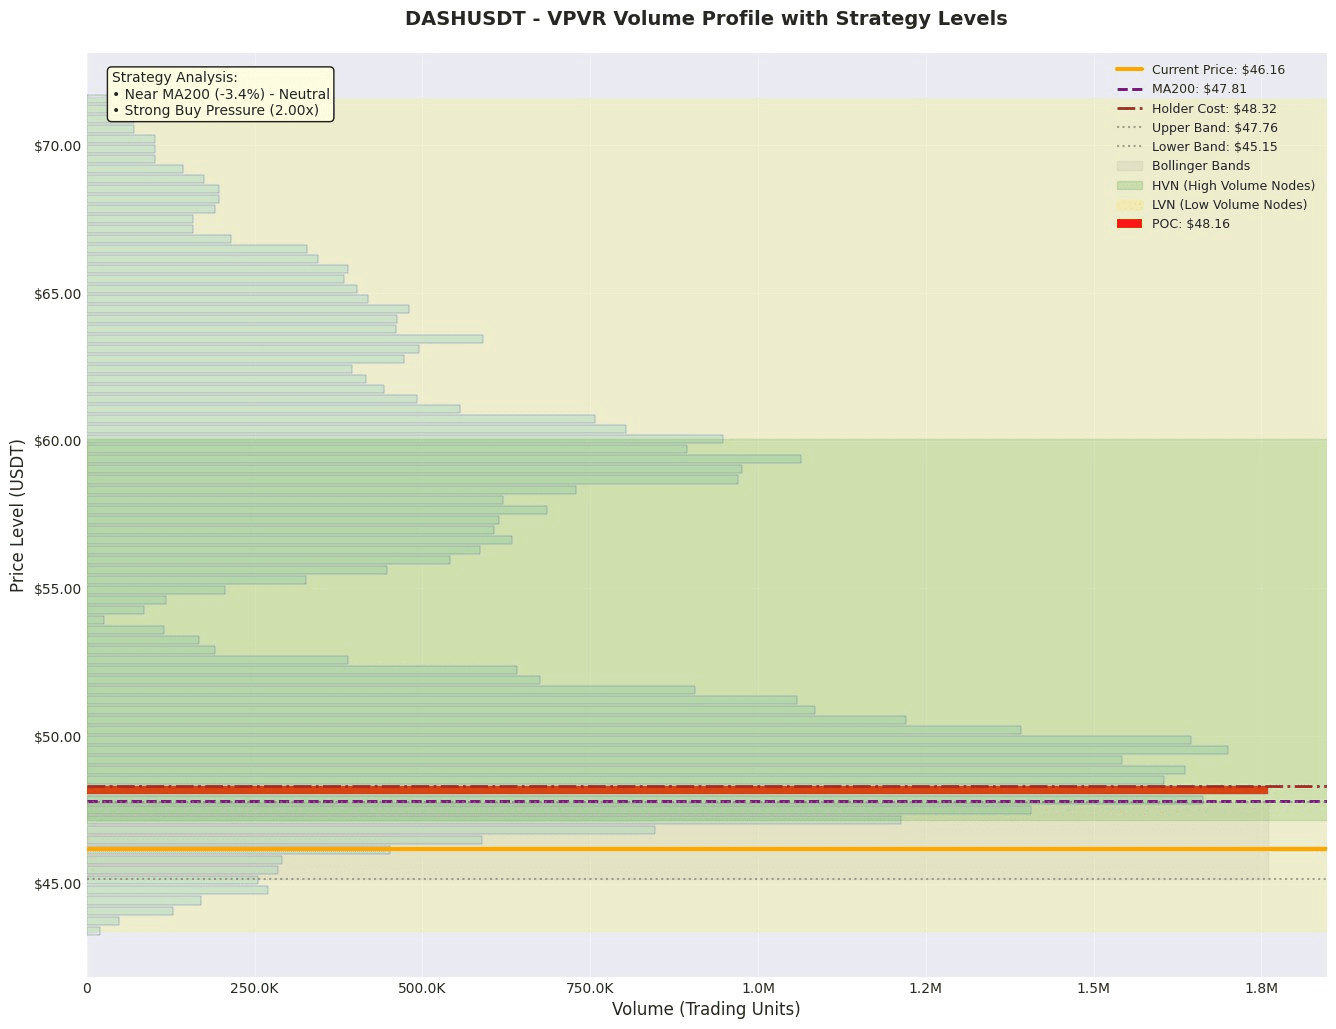
1. Value Anchor Zone: VPVR data shows that the current POC (Point of Control) is at 48.16, which is the recent value center and strong resistance level. The Value Area is between 46.46 - 63.44, and the current price of 46.16 is at the lower edge of this range (VAL). If it cannot effectively hold above VAL, the price may further look for support downwards.
2. Trend and Volatility Range: The current price of 46.16 is about 3.4% below the MA200 (47.81), indicating it is below the mid-to-long-term trend line, suggesting an overall bearish trend. Meanwhile, the price is between the middle and lower bands of the Bollinger Bands (45.15 - 47.76), with a Bollinger Band position of 38.7%, showing that the price is weakly operating within a short-term volatility range, close to the lower band support.
3. High Volume / Concentrated Area (HVN): The POC (48.16) is a clear high-volume area, forming the primary resistance above. Additionally, the upper edge of the Value Area at 63.44 is another strong resistance area far from the current price. There is no significant nearby HVN support below, and attention should be paid to the lower Bollinger Band at 45.15 and the main buying unit around 43.0 for support.
Derivatives and Liquidity Analysis
The current derivatives market shows signs of liquidity contraction and a cooling of the long-short game. Contract trading volume plummeted by 92.2% within 24 hours, which is a strong signal of liquidity exhaustion, typically indicating that a turning point is approaching. The open interest (OI) is 23810000, with an OI/market value ratio of 4.13%, which is at a relatively healthy level, with no extreme leverage accumulation. The funding rate is slightly positive (0.00006111), and the long-short ratio has slightly decreased from 1.6134 to 1.5754, indicating that leveraged long positions are slightly retreating but have not formed extreme short overcrowding. In this environment, the market lacks directional momentum, and high-leverage trading is easily washed out during price fluctuations, making it unsuitable to amplify leverage; it is advisable to maintain a light position or wait and see for volume recovery and clear direction.
News and Event Impact
Currently, there are no major news events directly related to the DASH cryptocurrency. The provided news summary mainly involves a media channel called 'Dash News', the U.S. stock company DoorDash (stock code DASH), and general news from CNN, which have no direct impact on the short-term price movement of DASH. Market sentiment is primarily driven by technical factors and on-chain data.
Trading Strategy
Plan One: Conservative Bottom-Fishing Strategy (Long)
• Direction: Long
• Logic: The price is close to the lower Bollinger Band and VAL support, with significant buying pressure on the order book (buy-sell pressure ratio 2.00x), aiming for a technical rebound.
• Entry Range: 45.15 - 45.50 (near the lower Bollinger Band)
• Stop Loss: 44.50 (with some space above the main buying unit 43.0)
• Target:
1. First Target: 47.76 (upper Bollinger Band)
2. Second Target: 48.16 (POC resistance)
• Profit and Loss Ratio Calculation:
• Entry Price Median: 45.33
• Stop Loss Price: 44.50
• Target Price 1: 47.76
• Risk: 45.33 - 44.50 = 0.83
• Potential Profit 1: 47.76 - 45.33 = 2.43
• Profit and Loss Ratio 1: 2.43 / 0.83 ≈ 2.93
Plan Two: Aggressive Breakthrough Strategy (Short)
• Direction: Short
• Logic: If the price rebounds to a key resistance level and fails to break through, and the trading volume does not effectively expand, the trend may continue to decline.
• Entry Range: 47.70 - 48.20 (resistance area where the upper Bollinger Band overlaps with POC)
• Stop Loss: 48.70 (above the POC)
• Target: 45.15 (lower Bollinger Band)
• Profit and Loss Ratio Calculation:
• Entry Price Median: 47.95
• Stop Loss Price: 48.70
• Target Price: 45.15
• Risk: 48.70 - 47.95 = 0.75
• Potential Profit: 47.95 - 45.15 = 2.80
• Profit and Loss Ratio: 2.80 / 0.75 ≈ 3.73
Risk Warning and Position Management
1. Liquidity Risk: Contract trading volume plummeted by 92.2%, with insufficient market depth, large orders may easily trigger severe price slippage, and stop-loss orders may execute at worse prices.
2. Trend Continuation Risk: The price has fallen below the MA200 and holding cost. If key support (such as 45.15) is lost, it may open up new downward space.
3. Long-Short Ratio Misleading Risk: Although the long-short ratio shows a bullish advantage, in a downward trend, this may indicate that a large number of retail long positions have been trapped, forming potential selling pressure.
Position and Risk Control Recommendations:
• Given the liquidity exhaustion and unclear trend, it is strongly recommended to avoid using high leverage (not exceeding 3 times).
• Total position should be strictly controlled, with single trade risk exposure not exceeding 1%-2% of total account funds.
• It is suitable to adopt a strategy of gradually testing with light positions, especially in Plan One’s bottom-fishing strategy, where one can enter in batches within the support range to lower the average price.
• If the price shows a significant breakout or breakdown at key points (such as POC or the lower Bollinger Band), but the contract trading volume remains sluggish, one should delay entering the market and wait for confirmation.
Like and follow for real-time updates!
$DASH
