
The current market is showing a weak fluctuation with reduced volume. The spot price is slightly below MA200 and the market average holding cost, but the Bollinger Band position indicates that the price is still in its upper half, and the market has not entered extreme weakness. The contract market has seen a surge in trading volume but a drop in price, indicating intense competition between bulls and bears, but the overall environment is not a one-sided trend, leaning more towards a fluctuation adjustment near key support levels.
Key prices and range structure
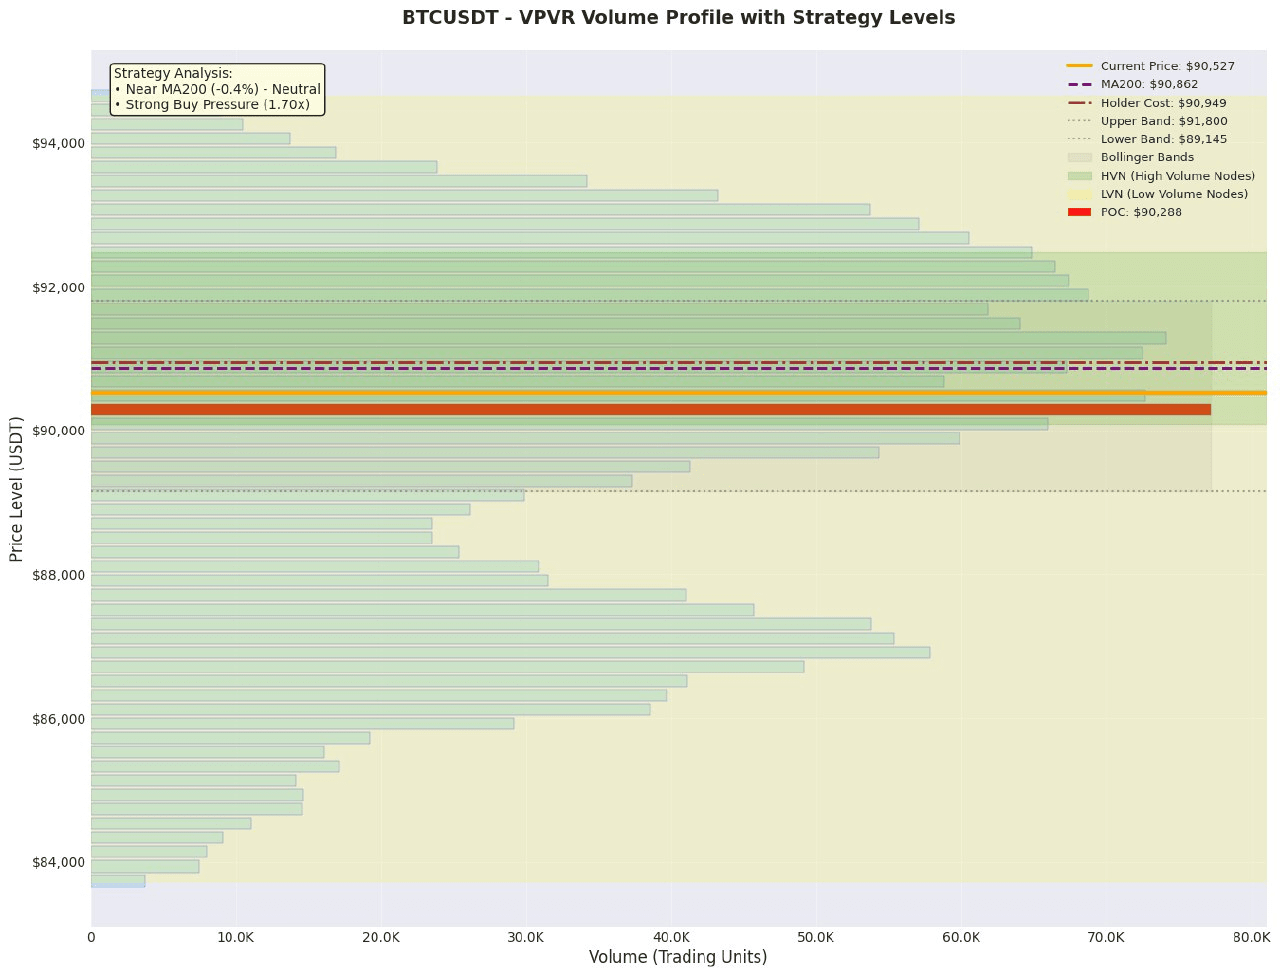
1. Value anchoring area: According to VPVR data, the current value anchor (POC) is at 90287.61, which is the balance point of recent bull-bear competition. The value area is from 86516.50 to 93264.81, and the price is currently at the upper position within this range, indicating that the current adjustment is still within a normal value range, with 86516.50 being an important lower support of the value area.
2. Trend and Volatility Range: The current price of 90527.49 is approximately 0.4% below MA200 (90862.44) and also below the cost of holding positions (90949.45), indicating a weak short-term market sentiment facing resistance from the medium to long-term trend line. The Bollinger Band range is from 89145.14 to 91799.76, with the current price at the 52.1 percentile, in a relatively strong oscillation range, with the lower bound of 89145.14 forming a key short-term support.
3. High Trading Volume/High Volume Node (HVN): The area near 90287.61 where POC is located is a clear high volume node, having a magnetic effect on the price. Additionally, the order book shows significant sell orders piling up at 91000.0 and 91193.12 (totaling over 1.36 million USDT), creating direct resistance above; while there are large buy orders accumulating at 89800.0 and 89368.08 (totaling over 4.57 million USDT), forming a strong support zone below. These areas will be key nodes for price movement.
Derivatives and Liquidity Analysis
The data shows that the contract trading volume surged by 173.7%, but open interest (OI) remains high at 7955.44M, indicating an extremely high OI/market cap ratio. The funding rate is slightly positive at 0.00005940, and the long-short ratio has slightly increased from 2.2478 to 2.2824.
• Leverage funds orientation: The slightly positive funding rate and rising long-short ratio indicate that leveraged funds are still generally biased towards bullish positions, but not extremely crowded. The surge in trading volume accompanied by price decline may suggest that bulls are facing selling pressure or actively closing positions at key levels (such as near MA200).
• Liquidity signals: There are no signals of a sharp drop in trading volume or a drastic decrease in OI, indicating that market trading remains active.
• Leverage advice: In an environment where prices are below key moving averages and there is intense competition in densely traded areas, market direction is unclear. It is not suitable to increase leverage; positions should be reduced or remain on the sidelines, waiting for clear directional choices at key support (like the lower Bollinger Band or large buy order areas) or resistance (MA200, dense sell order areas) before making decisions.
News and Event Impact
The current news summaries provided are all routine updates from cryptocurrency media (such as CNBC Crypto World, Bitcoin News, CoinDesk) and do not mention specific significant events that could directly impact market sentiment (such as regulatory policies, ETF fund flows, macroeconomic data, etc.). Therefore, there are currently no major news events driving the market, which is mainly dominated by technical factors and derivative fund competition.
Trading Strategy
Plan A: Conservative/Pullback Long Strategy
• Direction: Long
• Logic: The price is within the value range, with large buy orders (89800-89368) and the lower Bollinger Band (89145) forming a strong support zone below. Wait for the price to pull back to this area and gain support before entering.
• Entry Range: 89500 – 90000 (combined with the upper edge of large buy orders and below POC)
• Stop Loss: 88900 (approximately 1.5 times ATR space below the lower Bollinger Band, or outside the recent HVN)
• Target: First target 91500 (between MA200 and the upper Bollinger Band), second target 92500 (near the upper edge of the value area, VAH)
• Expected Profit/Loss Ratio: (91500 - 89750) / (89750 - 88900) ≈ 2.0 : 1 (calculated based on the entry median of 89750)
Plan B: Aggressive/Counter-rebound Short Strategy
• Direction: Short
• Logic: The price is constrained by MA200 and the cost of holding positions, with dense sell order pressure in the 91000-91200 area above. If the price rebounds to this area and shows signs of stagnation (such as a long upper shadow), a short position can be attempted.
• Entry Range: 90950 – 91150 (MA200 and dense sell order area)
• Stop Loss: 91450 (above the upper Bollinger Band)
• Target: First target 90200 (near POC), second target 89500 (upper edge of the lower buy support area)
• Expected Profit/Loss Ratio: (90950 - 90200) / (91450 - 90950) ≈ 1.5 : 1 (calculated based on the entry median of 90950)
Risk Warning and Position Management
1. Key Risks: The abnormal increase in contract trading volume (+173.7%) while prices decline poses a risk of long leverage being liquidated. The extremely high OI/market cap ratio indicates that the overall leverage level in the market is very high, and once broken, it can easily trigger a chain of stop-losses. The close-range order book shows a larger number of sell orders (buy-sell difference -117,141 USDT), and short-term selling pressure cannot be ignored.
2. Position and Risk Control Recommendations:
• It is strictly prohibited to open full positions at once. It is recommended to use a staggered entry strategy; for example, in Plan A, one can enter in two batches at 89800 and 89400.
• Strictly control total position and leverage. In the current high volatility and directionless market, it is recommended that total position risk exposure does not exceed 2% of the account capital, and to avoid using high leverage (such as exceeding 5 times).
• Active risk control: If the price drops below 89000 (large buy order area and the lower Bollinger Band), it should be regarded as a signal of weakening short-term structure, and all long strategies should be immediately paused or stopped. If the price quickly breaks through 91500 and stabilizes, the short strategy becomes invalid, and one should shift to a wait-and-see or trend-following operation.
Like and follow for real-time updates!
$BTC
