
The current SUI market is showing a weak fluctuating pattern with decreased volume. The spot and contract prices are basically on par, with a very small price difference, but the prices are below MA200 and the cost of holding, and the 24-hour decline exceeds 4%, indicating short-term dominance of bears. The contract trading volume has increased significantly by 76.1%, but the spot trading volume is only 0.3 times the average, indicating that market fluctuations are mainly driven by derivatives, and spot traders are in a strong wait-and-see mood. Overall, it is not a one-sided trend, but a typical 'active contracts, cold spot' fluctuation bottom-seeking stage.
Key prices and range structure
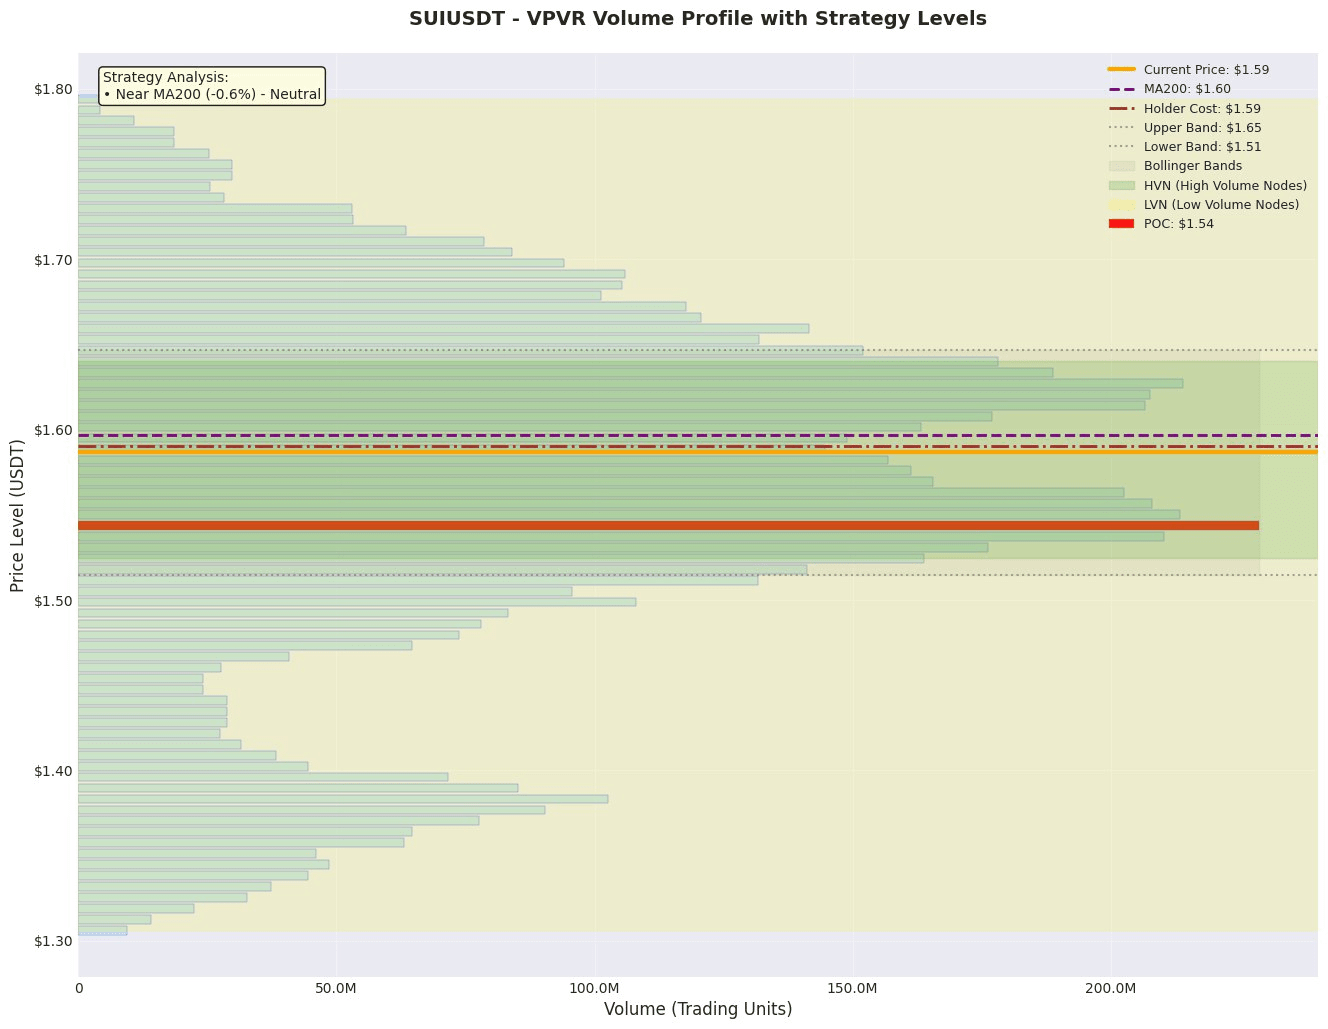
1. Value anchoring area: According to VPVR data, the current value anchoring area (Value Area) is from 1.383 to 1.691, with POC (Point of Control) at 1.543. The current price of 1.5865 is just located in the upper half of the value range, close to the upper edge VAH (1.691), but below POC, indicating that most of the chips traded recently are near 1.543. If the price breaks below the POC of 1.543, it may accelerate to find support at the lower edge VAL (1.383) of the value range. The VAH of 1.691 is a key short-term resistance level.
2. Trend and Volatility Range: The price (1.5865) is slightly below MA200 (1.5966), indicating that the medium to long-term trend is on the edge of the bull-bear dividing line, without establishing a clear upward trend. The Bollinger Band range is from 1.514 to 1.646, with the current price at 54.4% of the Bollinger Band, slightly above the middle track, but the overall width of the Bollinger Band is moderate, indicating price volatility within the range of 1.514-1.646. The Bollinger Band lower bound of 1.514 is a key support level in the recent past.
3. High Transaction Volume/Concentration Area (HVN): The POC (1.543) in VPVR is an important high transaction volume area (HVN) and is a significant point of attraction for prices. Additionally, the order book shows major sell orders at 1.86 (1319K) and 2.5 (581K), forming strong resistance above; major buy orders at 1.0 (499K) and 0.6 (454K), forming long-term support below. These large orders are potential liquidity targets.
Derivatives and Liquidity Analysis
• Leverage Fund Trends: The funding rate is only 0.00004394 (about 0.004%), nearly zero, indicating that the long and short forces in the perpetual contract market are temporarily balanced, with no significant unilateral leverage bets. The long/short ratio has slightly increased from 1.5047 to 1.5614, indicating a slight increase in long positions but not entering an extreme crowded range.
• Liquidity Signals: Contract trading volume surged by 76.1%, while open interest (OI) reached $131.43 million, with an OI/market cap ratio of 2.22%, which is at a relatively healthy level, with no signals of liquidity exhaustion from a sharp drop in trading volume or OI. This more indicates that new funds are speculating in the derivatives market amid price fluctuations.
• Leverage and Position Suggestions: Current leverage funds have not shown extreme sentiment, but the spot market's reduced volume indicates an unstable market foundation. In this environment, it is not suitable to use high leverage for one-sided bets. It is recommended to use low leverage or spot positions for range operations and closely monitor price breakthroughs at key support/resistance levels.
News and Event Impact
The current news summary shows that the SUI ecosystem has recent collaborative activities (such as partnering with Bluefin to promote institutional trading) and that the media continues to pay attention to its technological advancements (such as the Move language and Layer-1 technology). The overall sentiment of these news articles is neutral to slightly positive, mainly reflecting the routine development of the project's ecosystem and market exposure, providing emotional support for prices in the short term but unlikely to constitute a strong driving force. The current market trend is more dominated by technical factors and overall market sentiment.
Trading Strategy
Plan One (Conservative/Range Rebound Plan)
• Direction: Short-term rebound to go long
• Entry Range: 1.514 - 1.543 (Bollinger Band lower bound and VPVR POC overlapping area)
• Stop Loss: 1.50 (breaking the key integer level and recent low)
• Target: 1.596 (near MA200) or 1.646 (Bollinger Band upper bound)
• Expected Profit/Loss Ratio: With an entry at 1.53, stop loss at 1.50, and target at 1.646 calculated: Potential profit = (1.646 - 1.53) = 0.116, potential loss = (1.53 - 1.50) = 0.03, profit/loss ratio ≈ 3.87.
Plan Two (Aggressive/Breakout Following Plan)
• Direction: Go short after breaking support
• Entry Condition: Price effectively breaks below 1.514 (Bollinger Band lower bound) with confirmation
• Stop Loss: 1.543 (above POC)
• Target: 1.383 (lower edge of VPVR Value Area)
• Expected Profit/Loss Ratio: With an entry at 1.51, stop loss at 1.543, and target at 1.383 calculated: Potential profit = (1.51 - 1.383) = 0.127, potential loss = (1.543 - 1.51) = 0.033, profit/loss ratio ≈ 3.85.
Risk Warning and Position Management
1. Spot liquidity risk: The 24-hour spot trading volume is only 0.3 times the average, with insufficient depth. Once it breaks key points (such as 1.514), there may be an accelerated decline due to thin buying interest (liquidation), or a quick fall when rebounding due to heavy selling pressure.
2. Contract speculation risk: Contract trading volume surged by 76.1% while prices fell, caution is needed to determine whether this is a deliberate short position suppression or long positions being passively closed at critical levels. If prices rebound, it may trigger a rapid short squeeze due to concentrated short position liquidation.
3. Position and Risk Control Suggestions:
• Given the above risks, it is strongly recommended to adopt a staggered entry strategy rather than fully investing at once. For example, deploy 2-3 times within the entry range of Plan One.
• Total position risk exposure should be controlled within 1%-2% of total account funds. The current environment is not suitable for using high leverage (such as above 5x).
• If there is a significant drop below 1.50 or a resurgence in contract trading volume while prices stagnate and other extreme signals arise, one should actively reduce positions or pause new entries, mainly to observe and wait for a clearer market structure.
Like and follow for real-time updates!
$SUI
