
The current spot price is fluctuating narrowly below the MA200 and cost line, with the Bollinger Bands indicating the price is in a relatively strong area. However, trading volume has severely shrunk to 0.5 times the 24-hour average, indicating a lack of market activity and directional momentum. The contract market is showing extreme anomalies, with a 24-hour fluctuation of -100% and a trading volume plummeting by 96%, suggesting that there may be errors in the data source or that contract trading is extremely inactive, leading the market into a non-typical state of liquidity exhaustion and price stagnation.
Key prices and interval structure
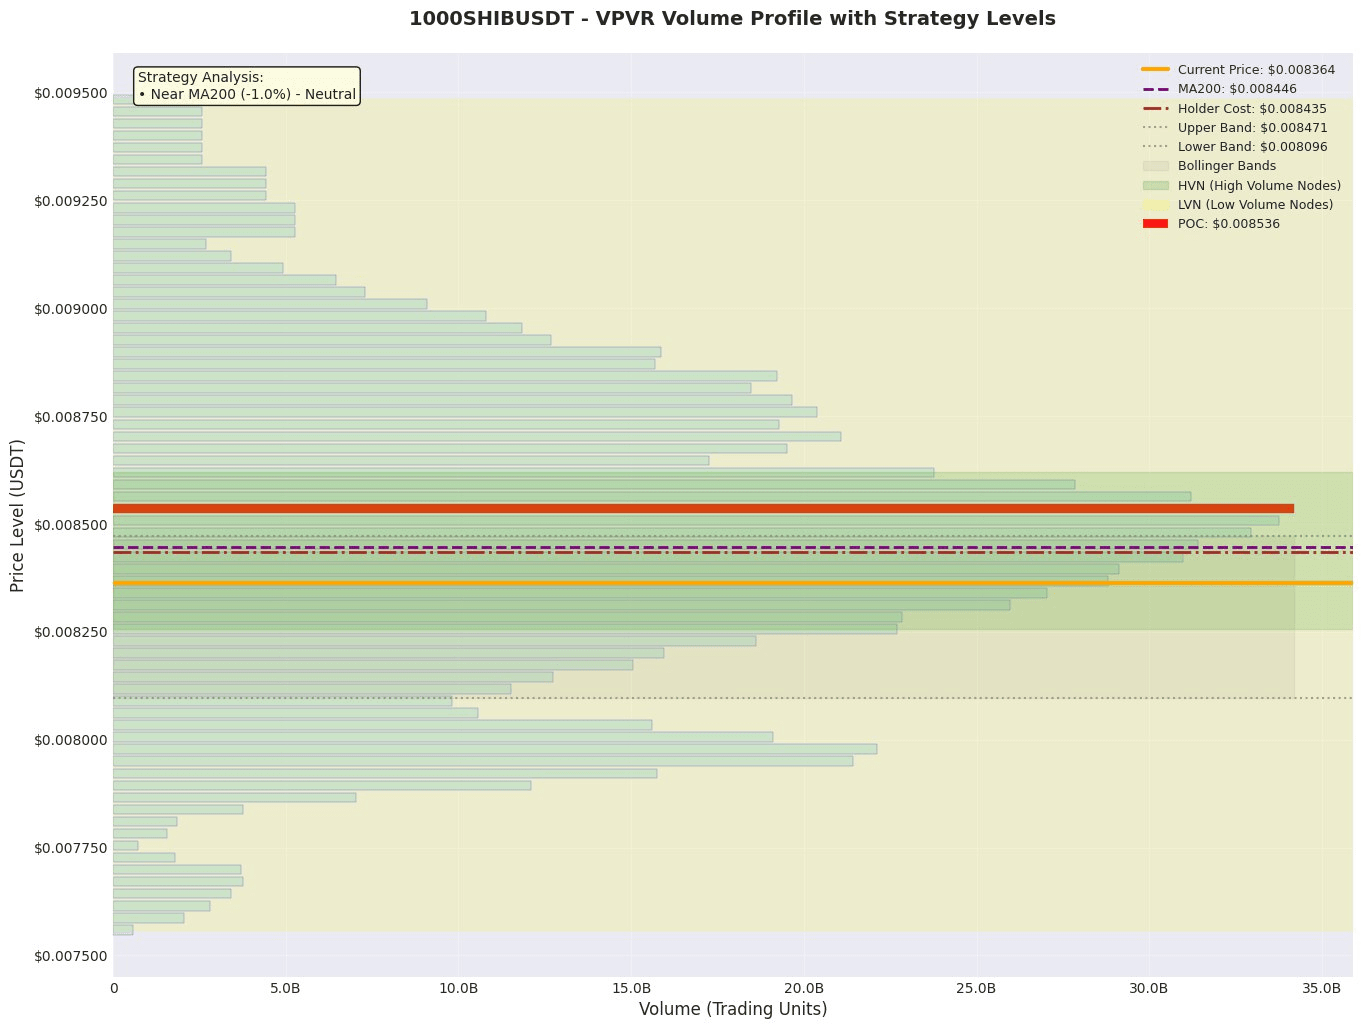
1. Value Anchor Area: According to VPVR, the 'value anchor' (POC) of this round of game is located at 0.008536, and the current price of 0.008364 is below it. The Value Area ranges from 0.007950 to 0.008898. This means the price is currently in the lower-middle part of the value range, with the POC (0.008536) representing the primary resistance above, while the lower edge of the value area (0.007950) is an important support reference.
2. Trend and Volatility Range: The current price of 0.008364 is slightly below MA200 (0.008446) by about 1.0%, indicating a weak medium to long-term trend. The Bollinger Band range (0.008096 - 0.008471) has narrowed, with the price located in the upper half of the Bollinger Band (71.4%), close to the upper band (0.008471). This suggests that the price faces upper band pressure in the short-term overbought area, but overall volatility is low.
3. High Volume / High Concentration Area (HVN): The 0.008536 area where the POC is located is a clear high volume area (HVN), and the price may encounter strong resistance or trigger fluctuations when it reaches this area. The lower boundary of the value area around 0.007950 is also expected to have concentrated positions, constituting key support.
Derivatives and Liquidity Analysis
Based on the provided data, the signals in the derivatives market are mixed, but the implied risk is present. The funding rate is positive (0.00010000), indicating a slight bullish preference in the contract market. However, the contract volume has plummeted by 96.0%, which is an extremely strong signal of liquidity exhaustion, usually meaning that market participants are extremely cautious or trading functions are abnormal. Open interest (OI) is 25.73M USDT, and the long-short ratio has dropped from 1.76 to 1.47, indicating a reduction in long positions.
• Leverage Preference: The funding rate indicates that leveraged funds are slightly bullish, but the decrease in the long-short ratio indicates a lack of confidence among bulls.
• Liquidity Signal: The 96% plunge in contract volume is a clear signal of liquidity crisis, with extremely poor market depth, making prices susceptible to sharp fluctuations due to small orders.
• Operating Environment: Extremely unsuitable for high leverage. In an environment of extreme volume contraction, the risk of slippage is very high, and positions should be significantly reduced or observation should be maintained, waiting for volume to return to normal and prices to show valid breakthrough signals before making plans.
News and Event Impact
The current news summaries provided (such as trading views from TradingView, price charts from CoinGecko, and general news about Shiba Inu) are all routine market information and data source updates, without specific significant fundamental events that can drive price changes. Therefore, it is judged to be neutral, with no significant direct impact on current market sentiment and price trends.
Trading Strategy
Plan A: Conservative Observation / Value Reversion Plan (Long)
• Logic: The price is below the holding cost and MA200, but within the value area, and the Bollinger Bands are narrowing, waiting for the price to pull back to a strong support area to stabilize.
• Direction: Long
• Entry Range: Near the lower boundary of the value area (VAL) around 0.007950, or near the lower band of the Bollinger Band at 0.008096, waiting for a bullish engulfing or long lower shadow confirmation on the 15-minute or 1-hour candlestick.
• Stop Loss Level: Below the low of the entry candlestick, or 0.007900 (below key support).
• Target Level: First target POC 0.008536, second target upper band of the Bollinger Band / upper boundary of the value area (VAH) 0.008898.
• Expected Risk-Reward Ratio: Calculated with entry at 0.007980, stop loss at 0.007900, and target at 0.008536: (0.008536 - 0.007980) / (0.007980 - 0.007900) = 0.000556 / 0.00008 = 6.95.
Plan B: Aggressive Breakthrough / Invalid Reversal Plan (Short)
• Logic: The price tests the upper band of the Bollinger Band and MA200 under reduced volume conditions with dual pressure. If it cannot break through with increased volume, it may reverse and decline.
• Direction: Short
• Entry Range: When the price rebounds to the MA200 (0.008446) or the upper band of the Bollinger Band (0.008471) and shows stagnation, a bearish Pin bar or engulfing pattern appears.
• Stop Loss Level: Above the high of the entry candlestick, or 0.008536 (above POC resistance).
• Target Level: First target is the middle band of the Bollinger Band (dynamically calculated, approximately 0.008284), second target is the lower boundary of the value area at 0.007950.
• Expected Risk-Reward Ratio: Calculated with entry at 0.008460, stop loss at 0.008540, target at 0.007980: (0.008460 - 0.007980) / (0.008540 - 0.008460) = 0.00048 / 0.00008 = 6.00.
Risk Warning and Position Management
1. Extreme Liquidity Risk: The 96% plunge in contract volume is a core risk, with extremely thin market depth, which may cause stop-loss orders to fail to execute at preset points, leading to unexpected enlarged losses.
2. Data Anomaly Risk: The 24-hour price fluctuation shows -100%, which does not match the actual price changes, indicating that underlying data may have errors, making decisions based on such data extremely risky.
3. Indeterminate Direction Risk: The price is caught between MA200 pressure and value area support, and with shrinking volume, there is a lack of clear direction in the short term, making it prone to chaotic oscillation.
Position and Risk Control Suggestions:
• Absolute prohibition on high leverage; it is recommended that the leverage not exceed 2 times.
• Total position is advised to be very light, with individual trade risk exposure not exceeding 1% of the total account capital.
• Adopt a phased entry strategy, only entering at key support/resistance levels when a clear candlestick reversal signal appears, avoiding opening positions at intermediate price levels.
• Given the liquidity exhaustion signal, the primary recommendation is to observe, waiting for contract volume to return to normal levels (e.g., recovering to around the 24-hour average) and for prices to form a clear breakthrough of MA200 or the boundaries of the value area before considering executing trades as planned.
Like and follow for real-time updates!
$1000SHIB