
“Observe the endless frontier of technology; gain insights into the future and lead the new era of investment research.”
This report is provided by the “WTR” Research Institute:
Member Twitter ID:
Golden Egg Diary@jindanriji; Elk Won't Get Lost@crypto_elk_; Forex Brother; Xibei@Asterismone;
The first round of WTR on-chain data subscription (OG) officially begins!
Data provided: WTR self-developed market short-term, medium-term, and long-term on-chain data, as well as data for some small coins.
First round pricing: 399U/year. Payment supports on-chain and off-chain transfers.
Other notes: We have prepared a strategy package for OG users. The strategy package has limited slots, and the current strategy package is only considered for the first round of OG users. Subscriptions can be directly added to the OG user group, for details please see the WeChat or Vxin number.

This week's review
This week, from October 29th to October 6th, the highest price of sugar orange was around $126,199 and the lowest price was close to $111,560, with an oscillation range of about 13%.
Observing the chip distribution chart, there are a large number of chip transactions around 113490, which will have certain support or pressure.
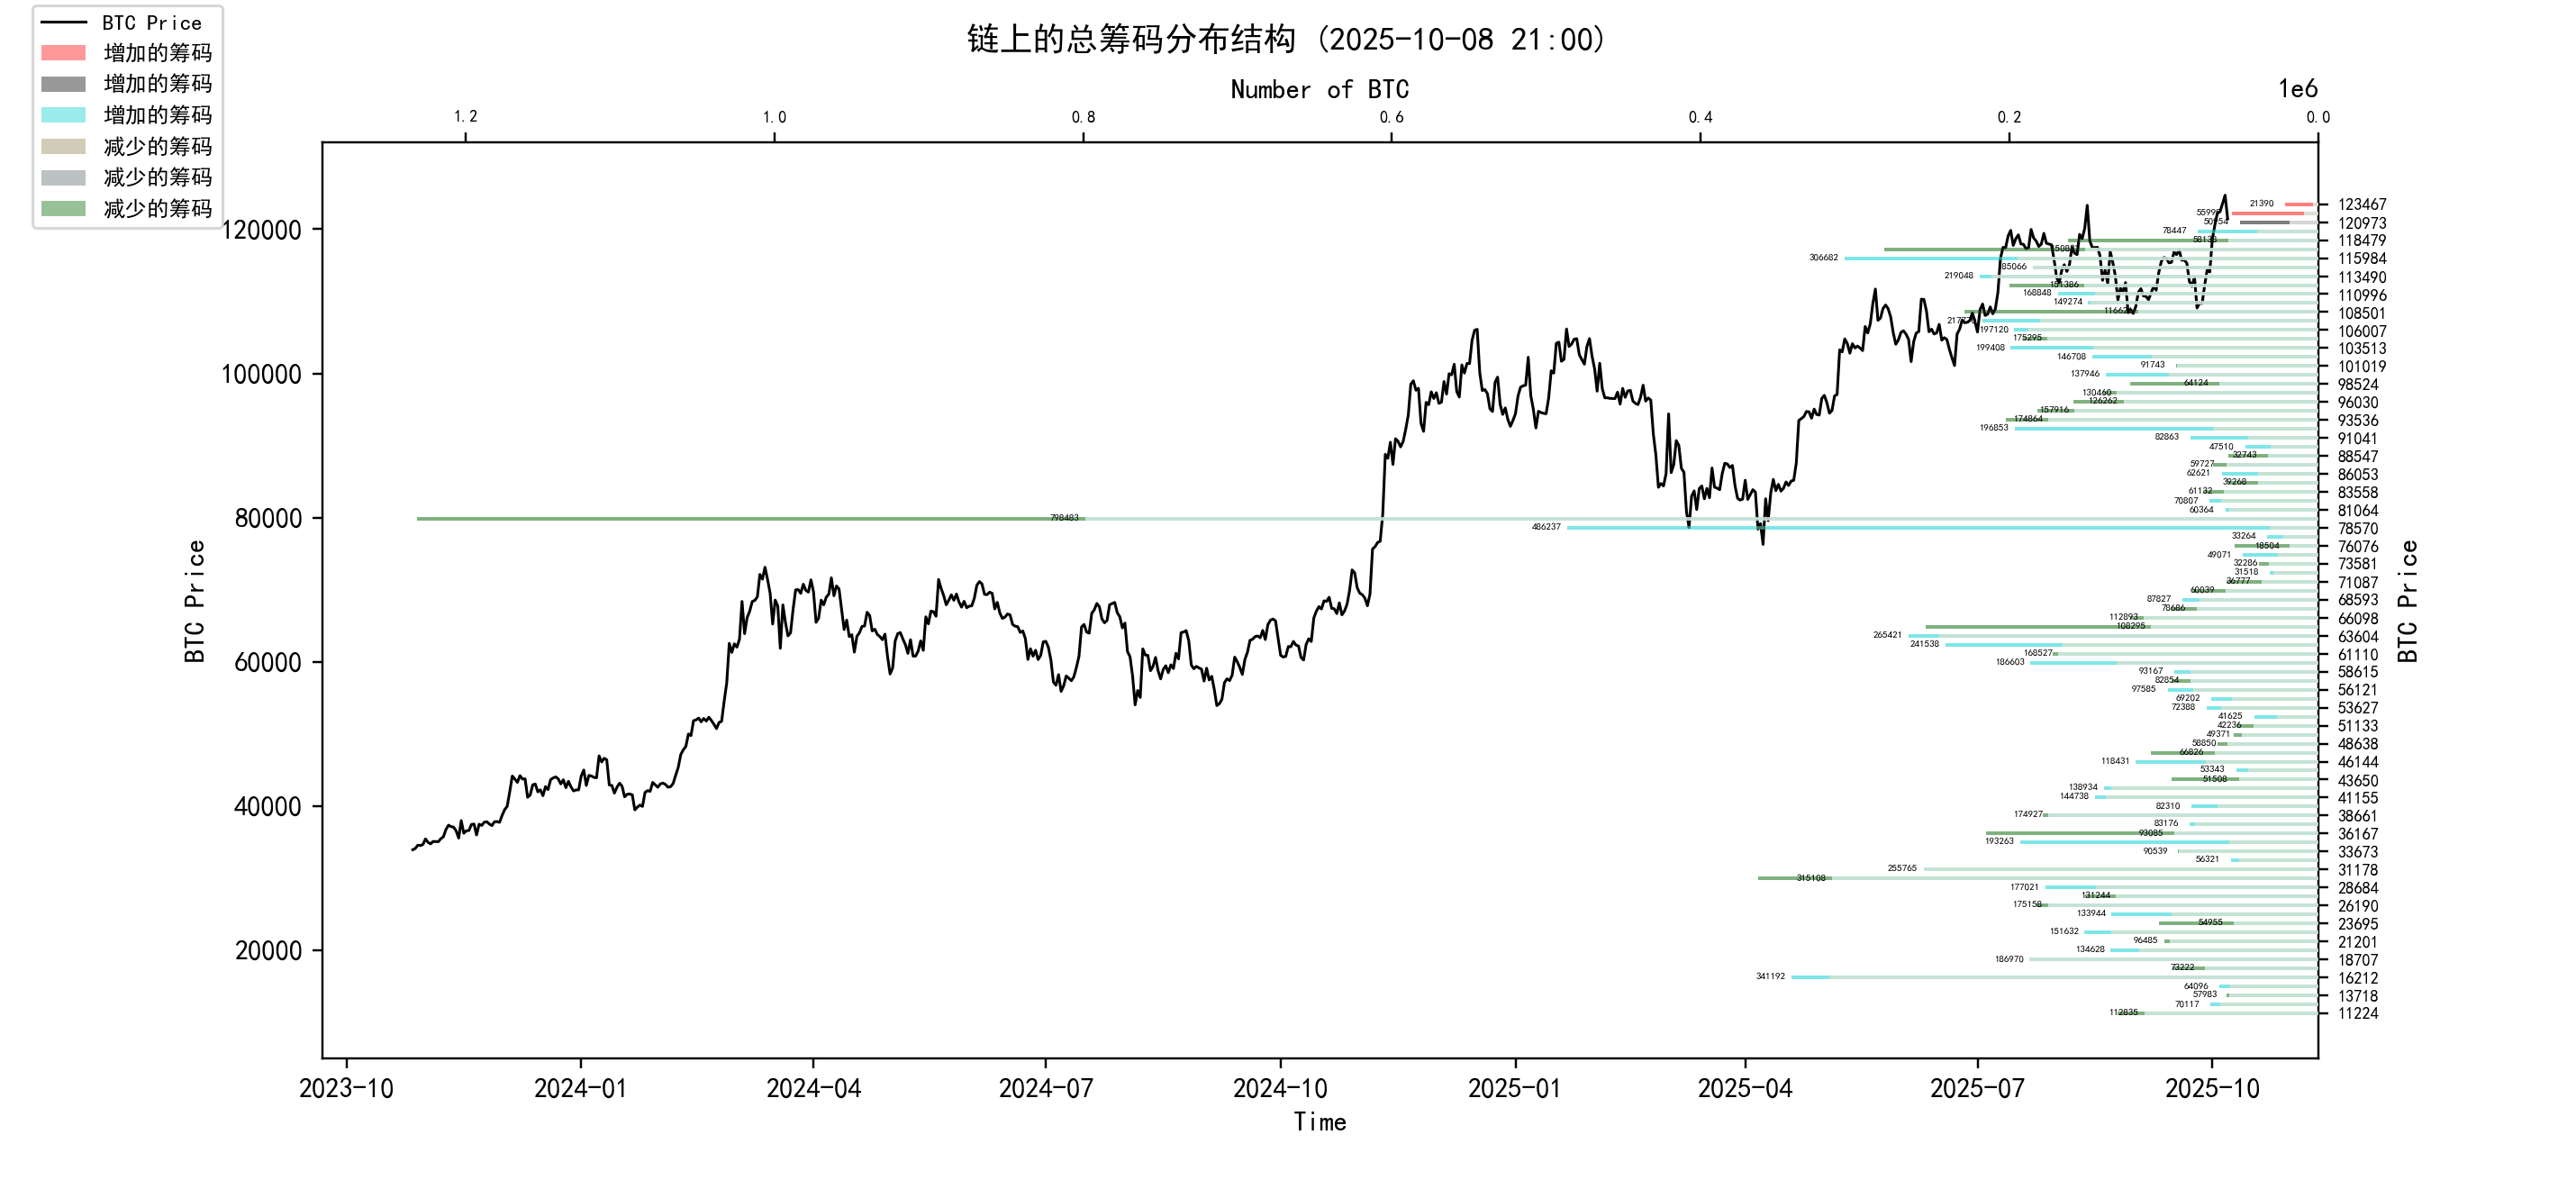
analyze:
60,000-68,000, approximately 1.23 million pieces;
76000-89000: approximately 1.7 million pieces;
90,000-100,000: approximately 1.21 million pieces;
About 2.49 million pieces above 100,000;
The probability of not falling below 110,000-105,000 in the short term is 70%;
Important news
Economic news
Federal Reserve Policy and Economic Outlook
Wait-and-see mode and data delays: Due to the US government shutdown that began on October 1, the Federal Reserve entered a "wait-and-see mode."
The release of key economic data such as the jobs report and the Consumer Price Index (CPI) has been delayed, adding to uncertainty about the Fed's decision.
The government shutdown is expected to shave 0.1 to 0.2 percentage points off gross domestic product growth each week, which could prompt the Federal Reserve to accelerate interest rate cuts at its late October meeting.
Internal divisions and rate cut expectations: The minutes of the September Federal Open Market Committee (FOMC) meeting showed that most officials supported a 0.25% rate cut, but new governor Stephen Milan advocated a larger 0.50% rate cut.
Officials’ comments signaled growing concerns about inflation risks from tariffs, which could delay further policy easing.
Views of large investment banks: Goldman Sachs predicts that the US dollar will continue to weaken due to the Fed's interest rate cuts.
JPMorgan Chase & Co. expects two rate cuts in 2025. Both investment banks highlighted the fragility of the job market and recommended that the Fed prioritize supporting economic growth.
US political and financial situation
Impact of government shutdown: The government shutdown that began on October 1 has resulted in the suspension of federal employee pay and delayed release of key economic data.
While the short-term impact on markets is limited, if it persists, it could drag down GDP growth by 0.15% per week.
Fiscal deficit concerns: The Congressional Budget Office (CBO) predicts that the fiscal deficit will reach 6.9% of GDP between 2025 and 2035.
President Trump's "Big Beautiful Act" has sparked controversy because it could lead to huge deficits.
International Trade and Tariffs
New tariff measures: President Trump announced on October 6 that a 25% tariff would be imposed on imported medium and heavy-duty trucks starting November 1.
Economic Impact of Tariffs: These tariffs have pushed average U.S. import tax rates to a century high, sparking uncertainty in global markets.
Goldman Sachs predicts that tariffs will lead to a decline in EU exports and could accelerate global free trade negotiations, while JPMorgan Chase warns that a trade war could push up inflation and slow global economic growth.
International Reactions and Responses: The Canadian Prime Minister plans to visit the United States on October 7 to discuss tariff exemptions. Meanwhile, the United States and China have extended their tariff truce by 90 days.
Crypto Ecosystem News
Market supervision and legislation
US legislative progress: Although the government shutdown may delay the review of the Crypto Market Structure Act (FIT21) until the end of October, the GENIUS Act, which aims to provide a framework for stablecoins, has been passed, becoming the first major cryptocurrency legislation in the United States.
Crypto political action committee (PAC) Fairshake has raised $141 million to support pro-crypto candidates.
International regulatory developments: The term of the Chief Executive of the Hong Kong Securities and Futures Commission (SFC) has been extended to 2028, and she supports stablecoins and asset tokenization.
The Hong Kong Monetary Authority requires stablecoin issuers to hold full reserves, and the European Union’s Markets in Crypto-Assets (MiCA) regulation will fully take effect in January next year.
Market Flow and Indicators
ETF Inflows: In the week of September 29 to October 3, US Bitcoin spot ETFs saw net inflows of $324 million, while Ethereum ETFs saw net inflows of $144 million.
Cumulatively, the inflow of funds into Bitcoin ETFs has exceeded US$50 billion.
Stablecoin Market Cap: The total market capitalization of stablecoins reached $303.244 billion, up 1.83% over the past seven days.
Altcoin Seasonal Index: The current index is 62, which belongs to "Bitcoin Season", which has decreased compared with the past 7 days. Bitcoin's dominance rate has risen to 60%.
Institutional and national holdings dynamics
Institutional holdings increased: Currently, 68 listed companies hold 859,000 bitcoins, accounting for 4% of the total supply.
It is expected that the number of institutions holding positions will exceed 100 by the end of 2025. Institutional investors plan to increase their allocation in crypto assets to more than 5% of assets under management (AUM) in 2025.
Trump Administration Holdings: It has been disclosed that the Trump administration's reserves include a variety of crypto assets such as Bitcoin, Ethereum, Solana, Ripple, and Cardano.
Market analysis and forecast
Professional institutions predict: Bernstein predicts that the price of Bitcoin will reach US$200,000 by the end of 2025, and VanEck predicts it will reach US$180,000.
Goldman Sachs predicts that the price of Bitcoin will be $151,000 in 2025. Most analysts believe that institutional adoption is the main driving force behind the market rise.
Regulatory clarity is seen as a long-term positive for the market, but tariffs and the risk of a recession could trigger a market correction.
Long-term insights: used to observe our long-term situation; bull market/bear market/structural change/neutral state
Mid-term exploration: used to analyze what stage we are currently in, how long this stage will last, and what situations we will face
Short-term observation: used to analyze short-term market conditions; the possibility of certain directions and certain events occurring under certain conditions
Long-term insights
Changes in the holdings of illiquid long-term whales
Total selling pressure on the chain
ETF reserves and net flows
Term structure of long-term holders of more than half a year
Net transfers by exchange whales
Short-term speculator cost line
(Changes in holdings of illiquid long-term whales)
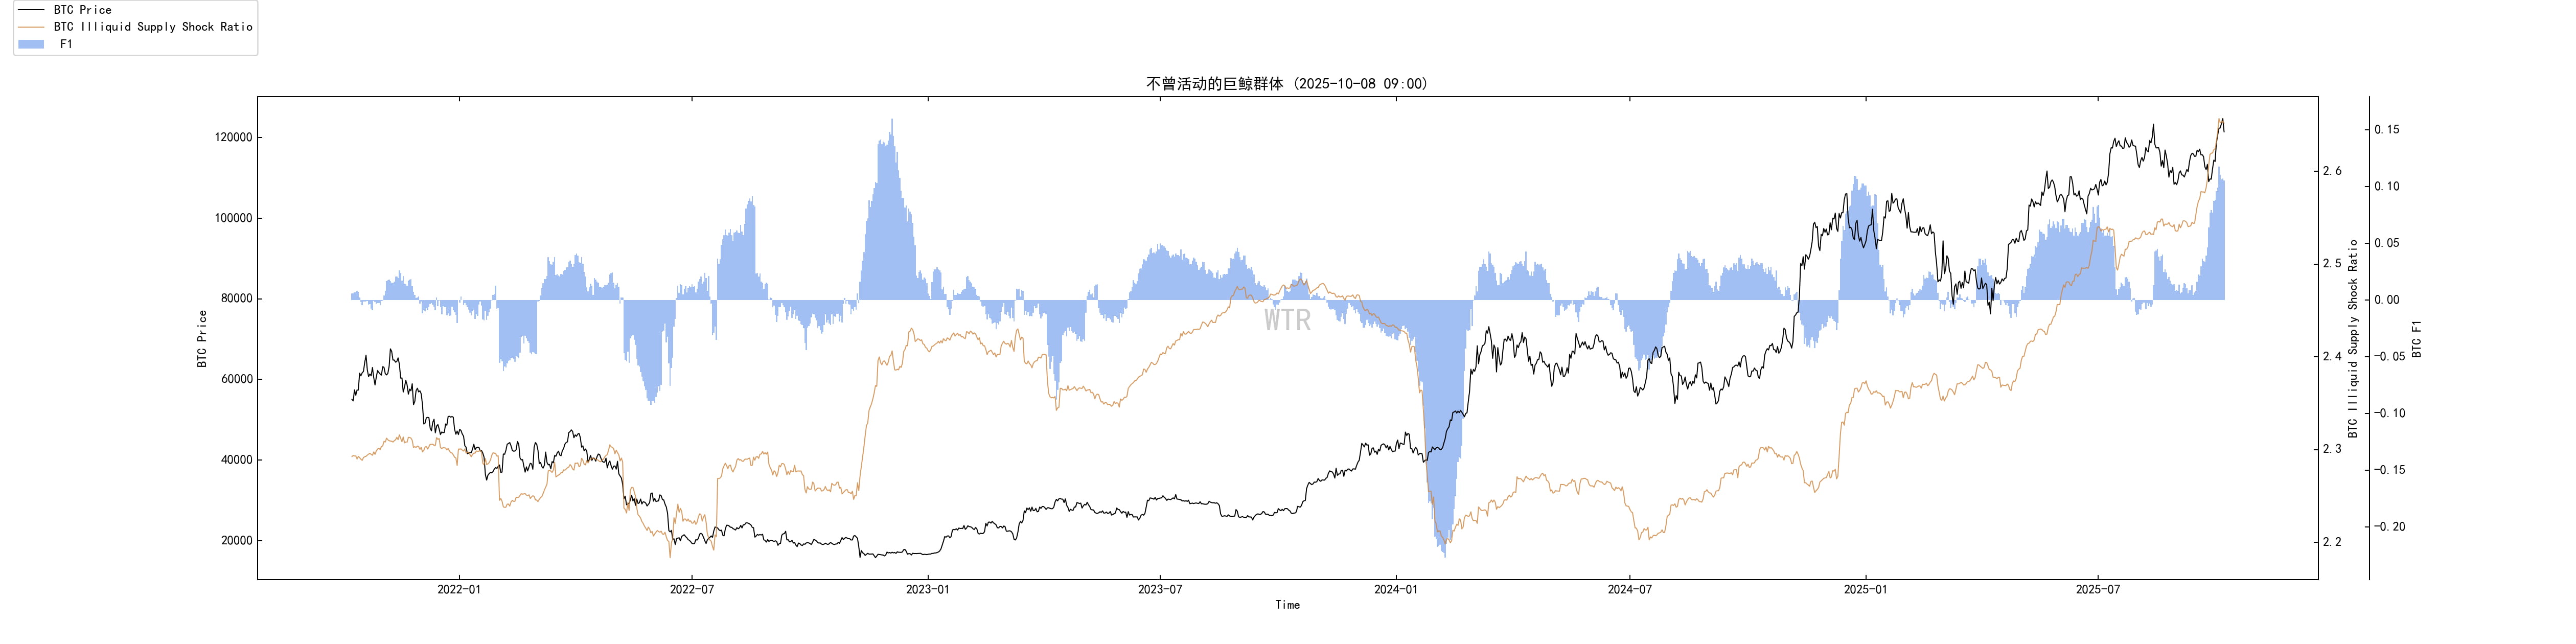
In the range where the price fell from about $116,000 to $108,500, illiquid long-term whales (yellow line in the figure) showed rapid holdings, and their holdings change rate (blue line) turned from negative to positive and significantly amplified.
However, after the price attacked upwards near $125,000, its accumulation momentum weakened significantly.
This clearly depicts a buyer's ladder:
Below $116,000, and especially below $110,000, whales are determined to buy;
When the price exceeds $125,000, marginal purchasing power turns cautious.
The illiquidity attribute means that these absorbed chips will not flow back into the market to form secondary supply in the short term, thus providing solid support for price pullbacks.
To effectively break through the resistance of $125,000, the market currently needs the injection of new external funds.
The risk is that if the whales' buying behavior continues to stagnate or even turns to decline, the market may enter a consolidation phase of "trading time for space" due to the lack of core upward fuel.
(Total on-chain spot selling pressure)
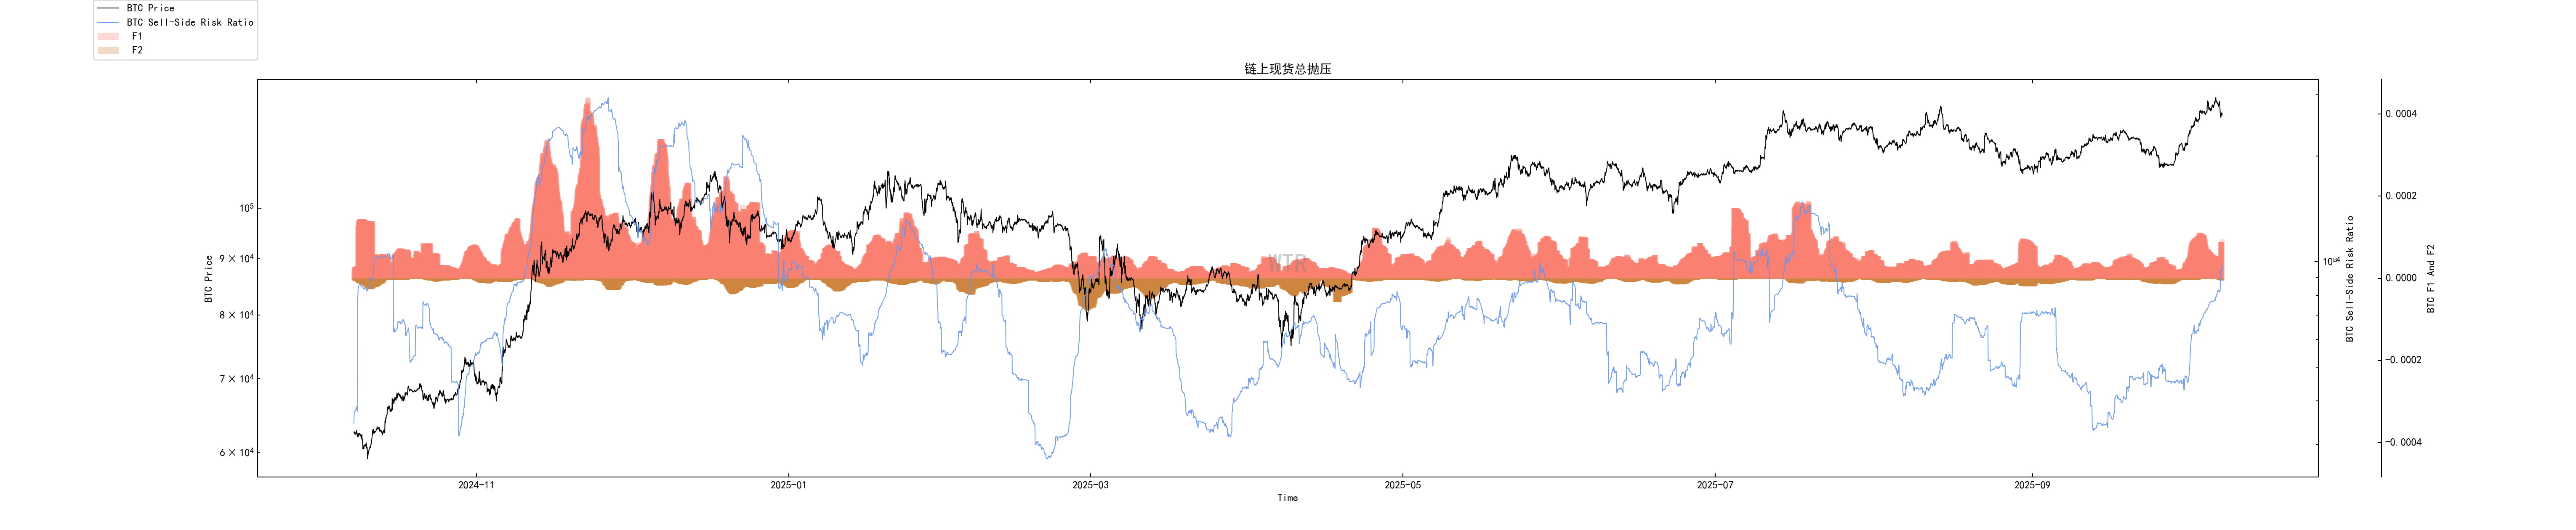
At present, the total selling pressure, which is composed of profit-taking from profitable positions and selling to unwind losses, is at a medium-to-high level and is showing a slowly upward trend.
This is a typical feature of healthy turnover in the market during an uptrend, but digesting this selling pressure requires stable and patient buying.
If the power of the takers (such as whales or ETFs) weakens simultaneously, the current digestible selling pressure may turn into a force that directly suppresses prices.
If the selling pressure indicator continues to rise and the price falls below the cost line of short-term holders, the market may switch from the shock digestion stage to a deeper pullback and accumulation stage.
The main risk is that if selling pressure remains high and incremental funds fail to follow up, the price will be repeatedly frustrated in the upper range (US$120,000-125,000).
(ETF reserves and net flows)
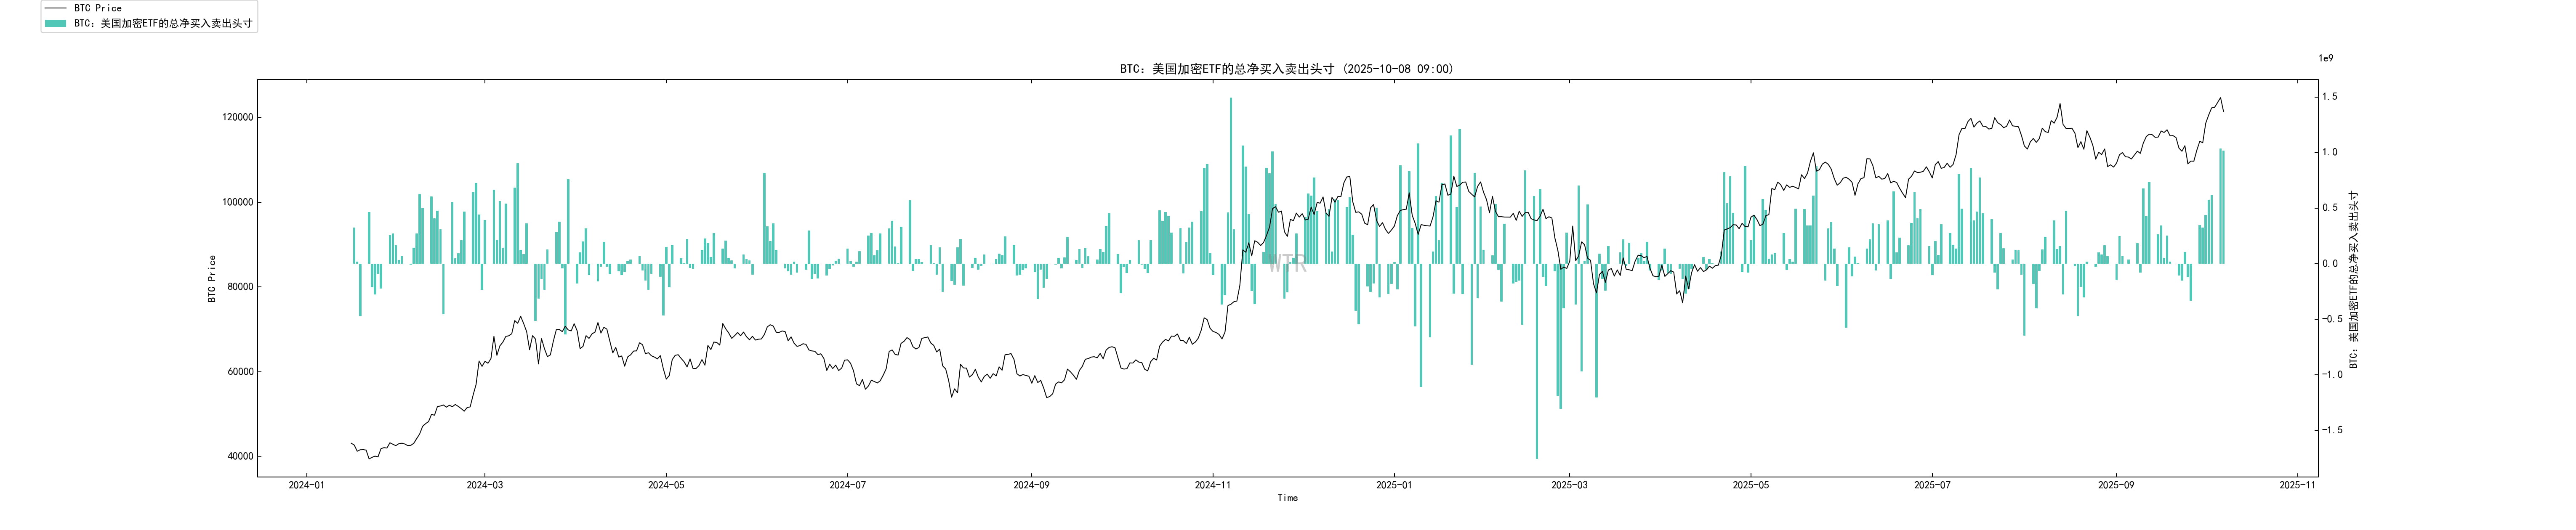
After hitting bottom in the previous period, the net flow of ETF funds has turned positive and continued to expand, in line with the rise in prices.
Although the increase in capital inflows is not explosive, its continuity is well maintained.
ETFs represent the market's sticky bedrock capital, absorbing selling pressure in a structural and steady manner.
In the upside resistance zone, the current modest inflow into ETFs alone is not enough to independently drive a breakthrough, but it is enough to provide effective support on price pullbacks and "buy back" the depth of the decline.
Sustained small net inflows on a daily or weekly basis are a heartbeat signal to maintain market confidence. Once ETF net inflows turn negative for consecutive days, the market risk weight needs to be immediately raised.
(Term structure for long-term holders of more than six months)
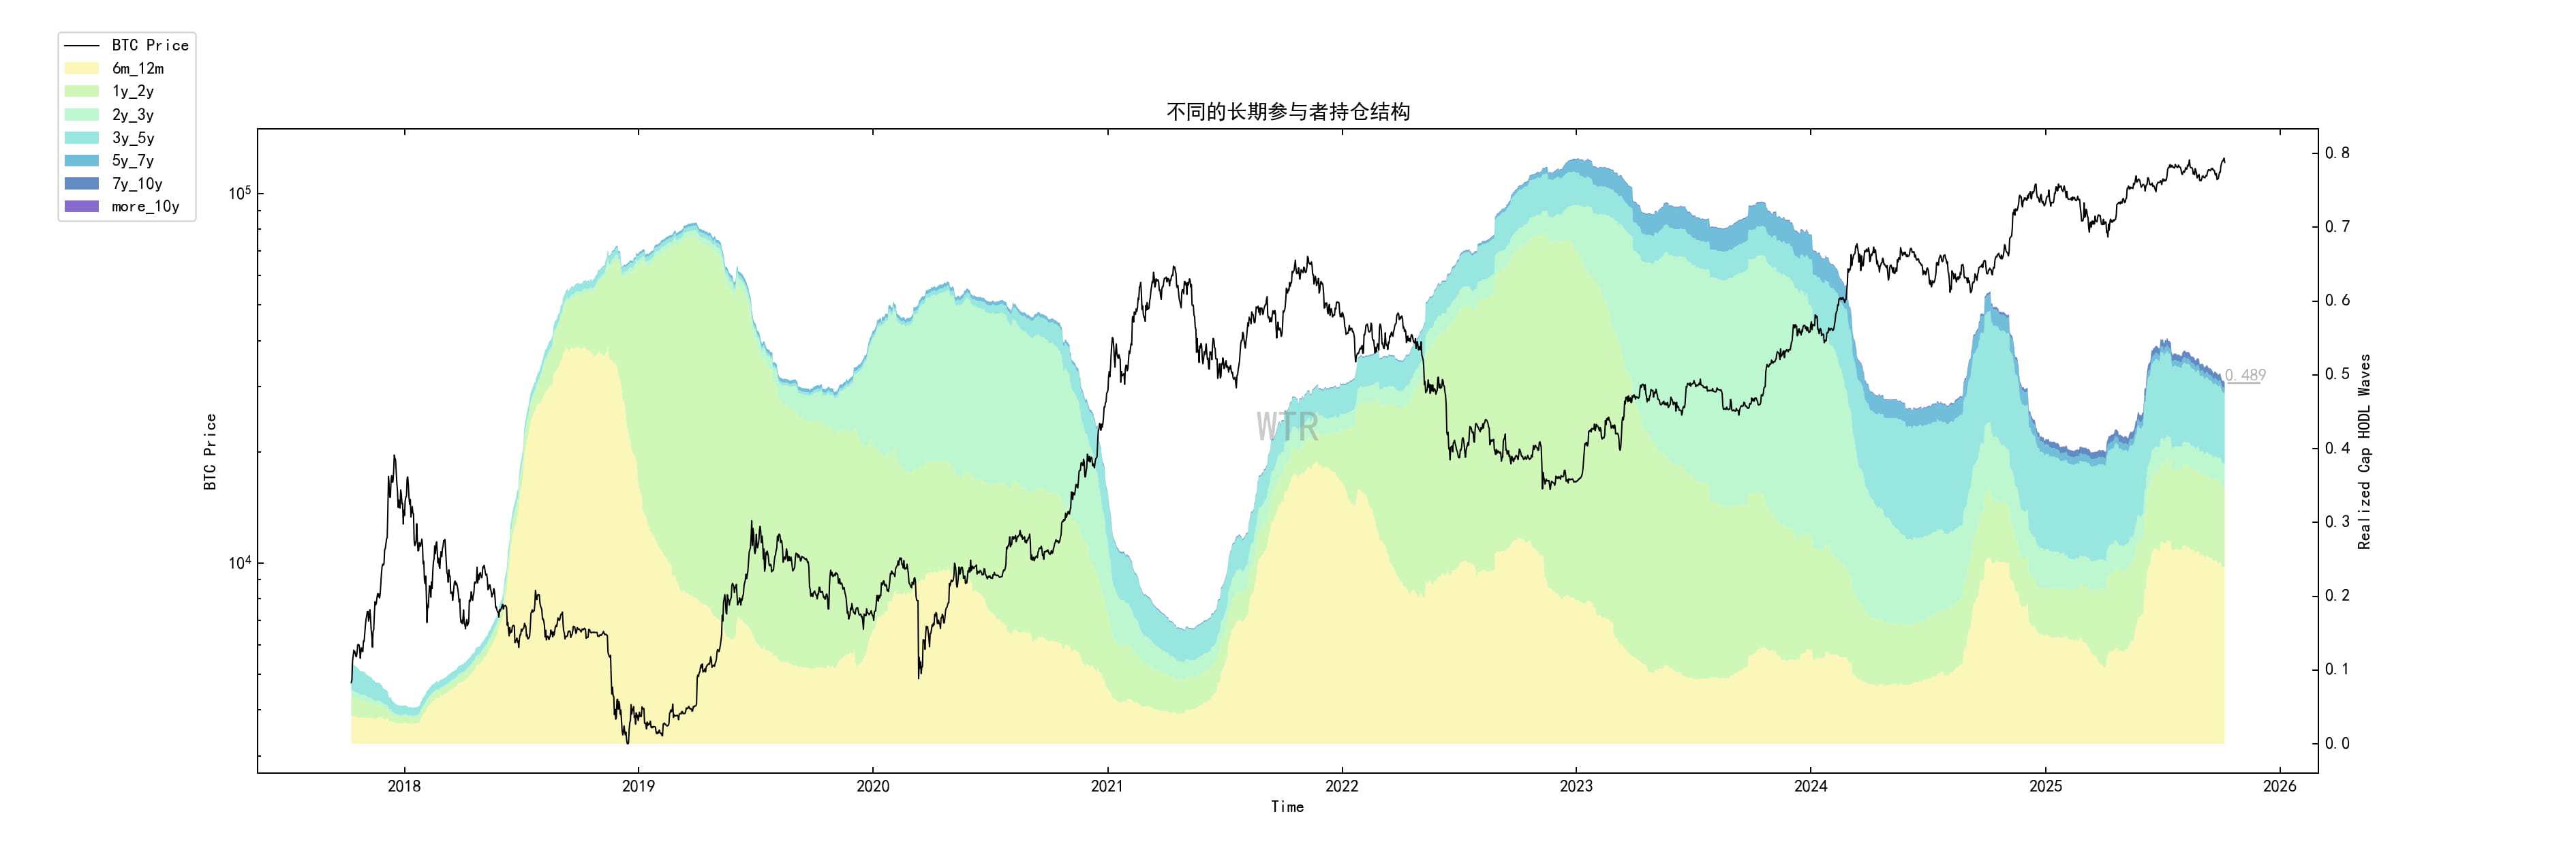
The percentage of supply held for more than 6 months has decreased slightly to 0.489 from a recent high of 0.527.
This reflects a moderate allocation of chips, not a panic-driven sell-off. A more plausible explanation is that early chips are flowing to new investors or new holding channels (including ETFs and custodial accounts).
As long as illiquid whales and ETFs are still actively absorbing, this redistribution of chips is neutral to bullish rather than bearish.
However, if the proportion continues to decline slowly while prices continue to rise steadily, it means that the "distribution → sedimentation" chain is operating healthily.
On the contrary, if the proportion drops sharply and the price is under pressure, it means that the quality of the takeover orders is deteriorating.
(Net transfers by whales on exchanges)
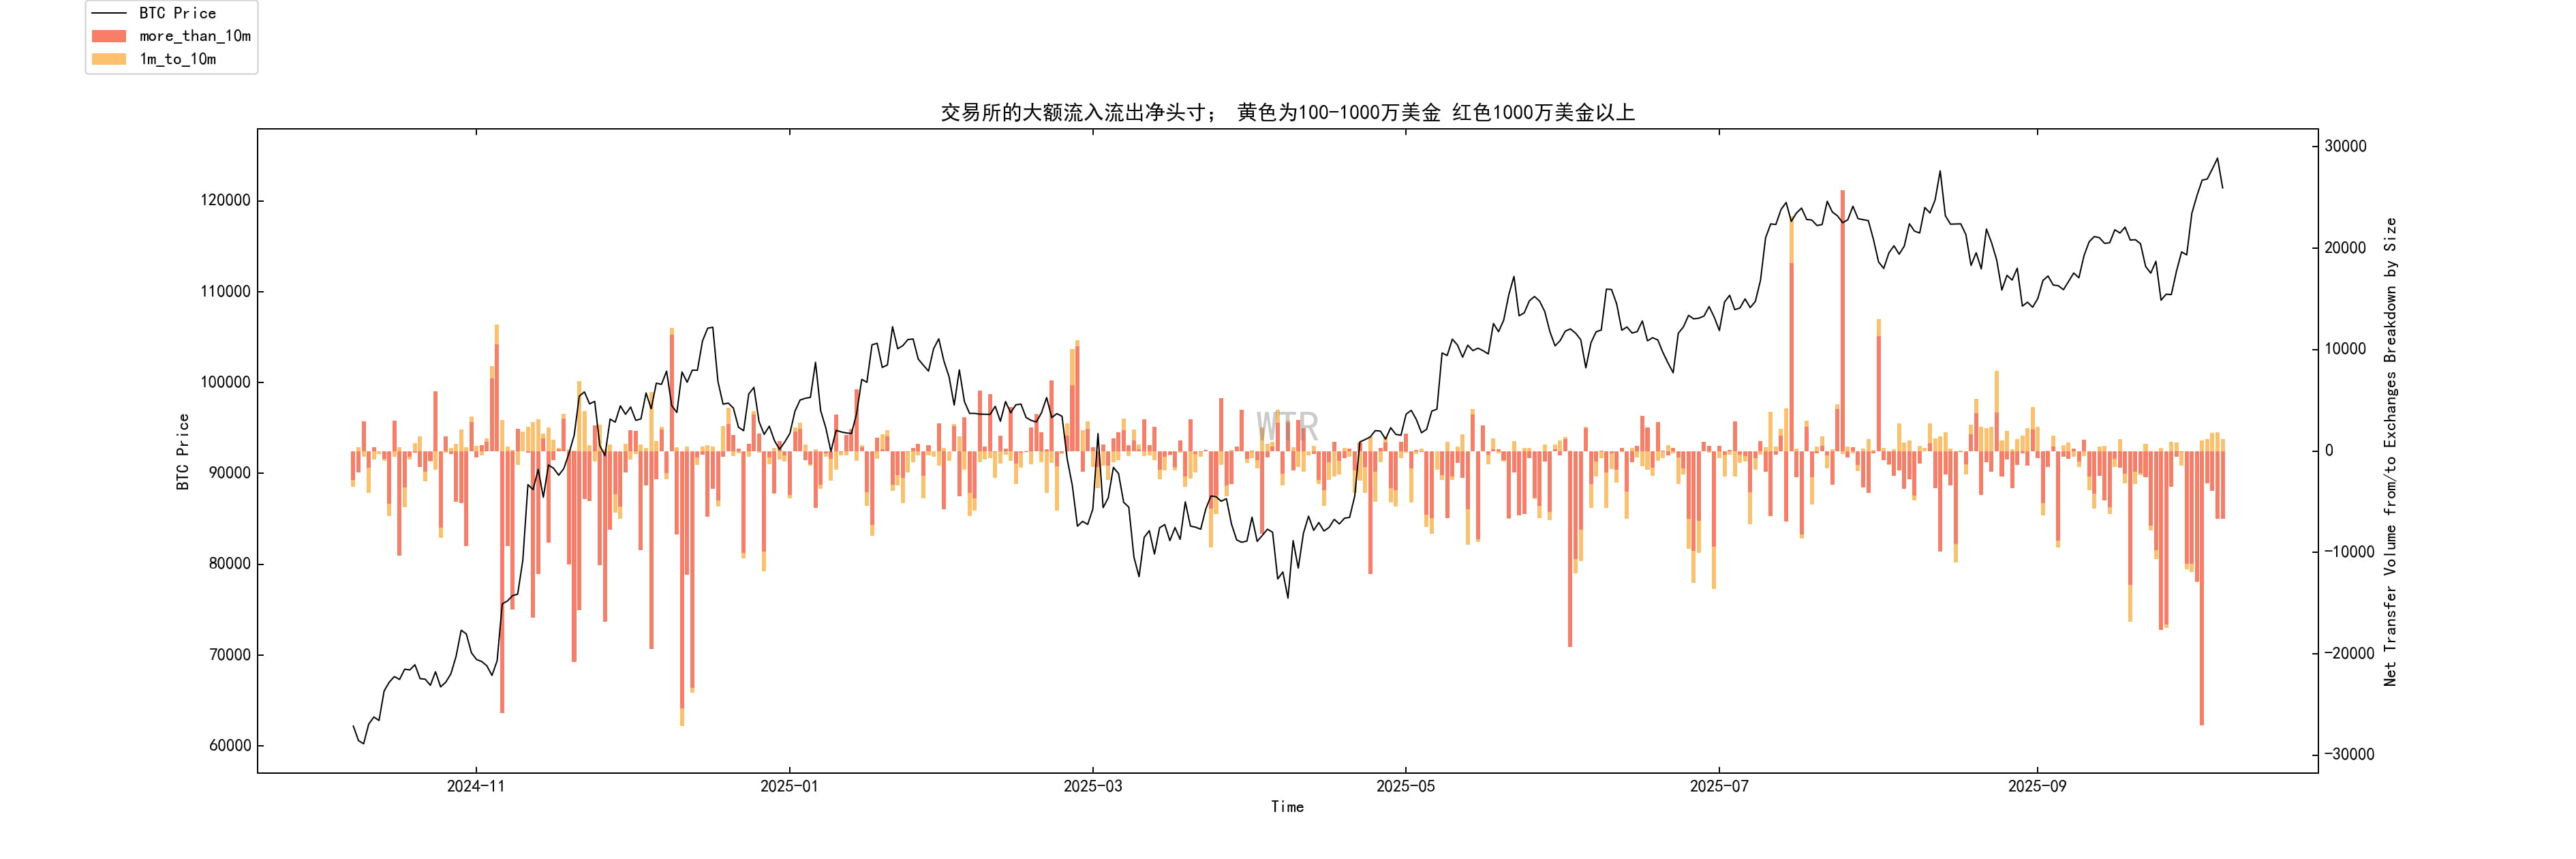
The data shows a clear three-part structure:
In the $109,000-110,000 range, the market saw multiple large withdrawals (cold storage accumulation);
Buying and withdrawal activities can still be observed around $114,500; when the price reaches above $120,000, large-scale whales tend to be cautious, while medium-sized whales increase their transfers to exchanges, and market divergence widens.
The $109,000-116,000 range is a proven effective takeover zone, while the $120,000-125,000 range has become a dense trading layer for profit-taking.
The fact that the whales are transferring their chips to the exchange at high levels means that the potential selling pressure has been brought to the surface. If this area is to be broken through, stronger buying power will be needed to intervene.
Risk: If the price falls back to around $110,000, it is expected to trigger rapid withdrawals again.
On the contrary, if we repeatedly see an increase in net inflows into exchanges in the $120,000-125,000 range, this upper resistance will be difficult to overcome in the short term.
(Short-term speculator cost line)
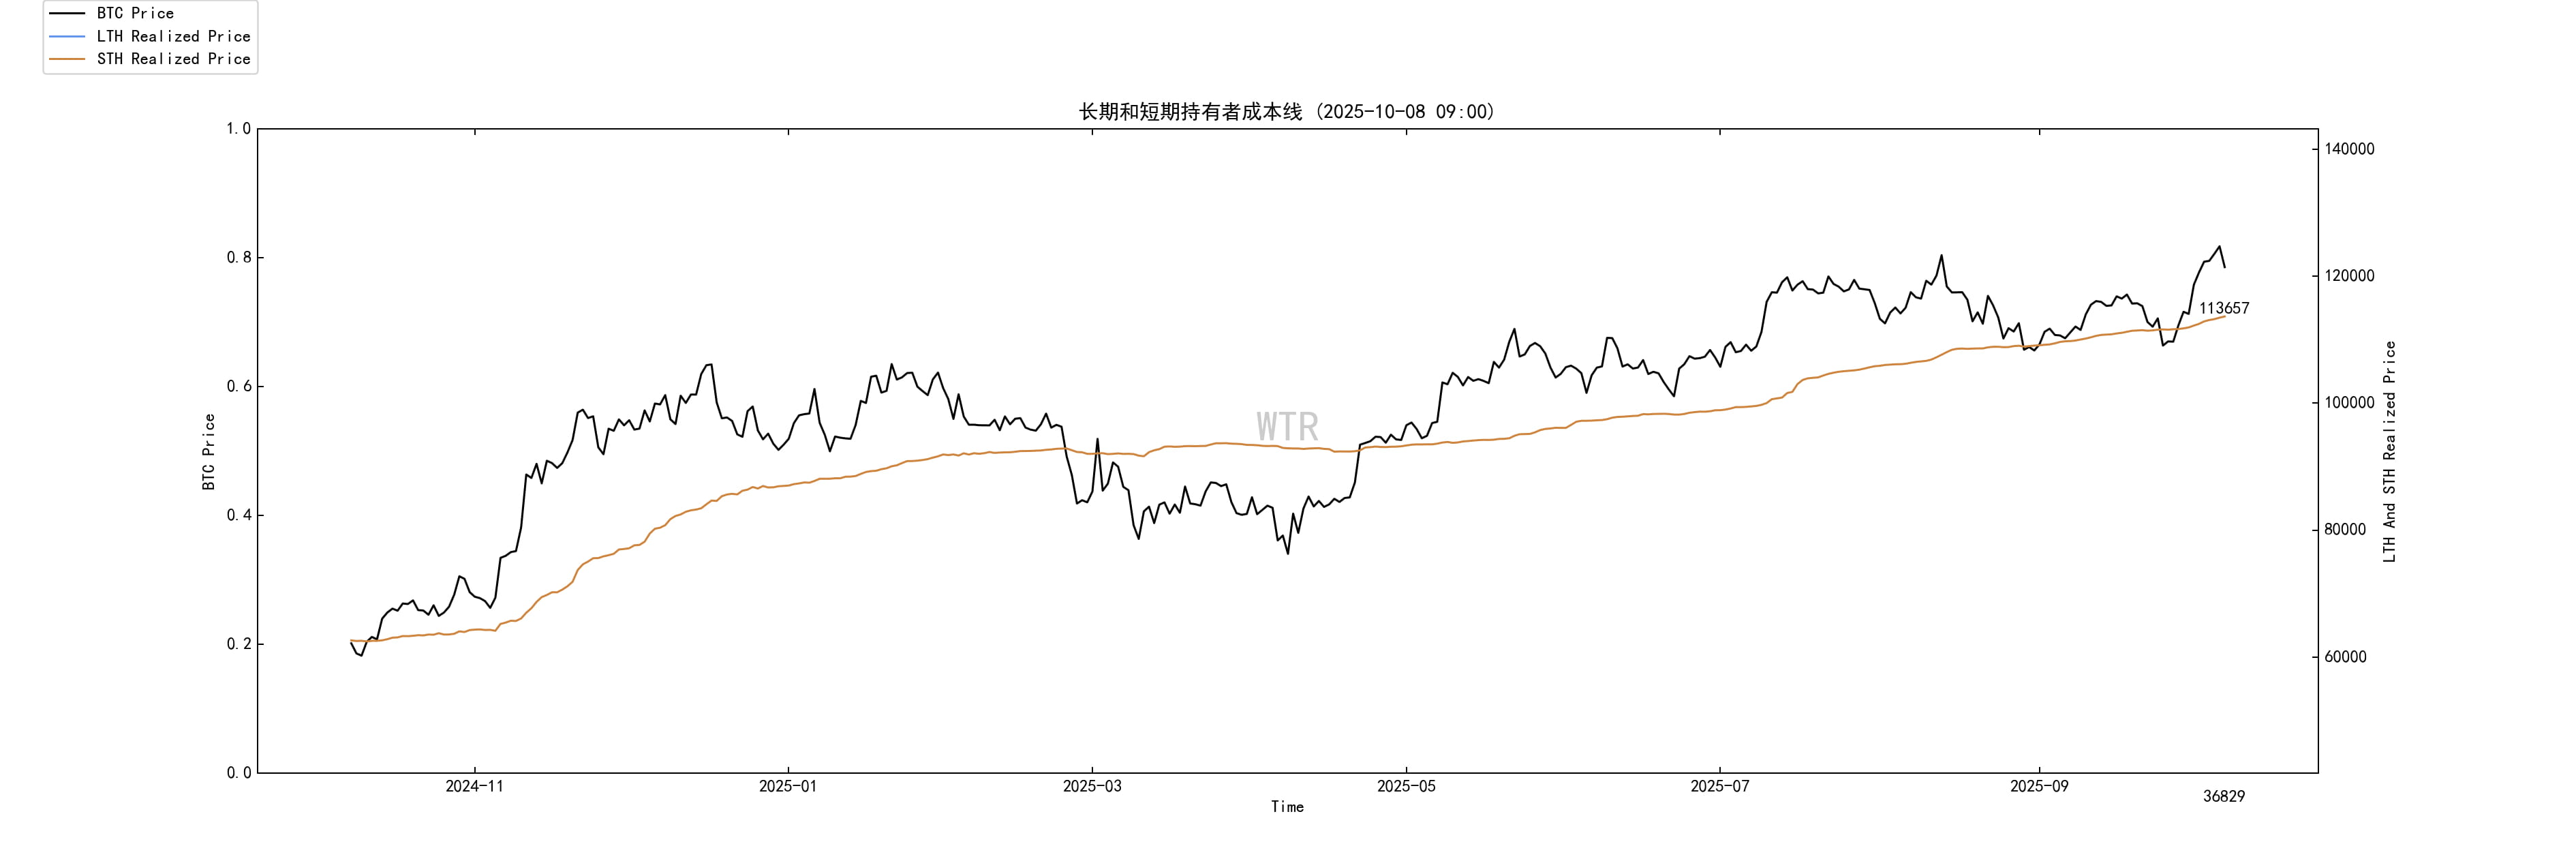
The average holding cost for short-term holders has moved up from $106,800 to approximately $113,600.
After briefly breaking below this line, the price has regained its footing.
This cost line is an important threshold for market behavior.
When the price is above the line, short-term holders are more inclined to be reluctant to sell or increase their positions; once it falls below the line, it is easy to trigger stop-loss and negative feedback.
The steady rise in the cost line itself indicates that new funds are willing to hold at a higher cost, which is positive for the trend.
As long as the price remains above the line and the line slopes upward, the short-term trend favors the bulls.
If the price falls again and ETF funds weaken, the market rhythm will quickly switch to a pullback and accumulation of funds.
Overall analysis
Combining the on-chain structure with the macro and news perspectives, we can draw the following conclusions:
Macroeconomic background: The data vacuum and growth drag caused by the US government shutdown have led the Federal Reserve to lean towards a small interest rate cut at the end of October.
However, the lagged inflationary pressure brought about by the new tariffs starting in November and the increase in term premiums due to fiscal deficits will cause the US dollar and long-term interest rates to fall into a high volatility range.
Fund entry:
ETF and stablecoin channels maintained net inflows, but the increase was moderate, indicating that long-term funds continued to be deployed, while Kuaiqian remained cautious.
On-chain structure:
This is a typical market structure with strong support, weak growth and pressure on the upper edge.
On-chain data clearly demonstrates credible bottom buying (strong accumulation by illiquid whales between 109k-116k), while also revealing clear upper resistance (high total selling pressure and moderate distribution by long-term holders).
The short-term cost line has been re-established, which is a key signal for maintaining the current rhythm.
The market's pullback is supported by buying, but an upward breakthrough requires a large impact of incremental funds at the event level or capital level.
If the macro level provides a favorable window for short-term interest rate easing and a weak US dollar, the market structure will naturally evolve upward;
On the contrary, if tariff inflation becomes dominant, the market may turn to a volatile pullback, exchanging time for space.
Short-term outlook:
The market will most likely be dominated by strong fluctuations, repeatedly consolidating the foundation above $114,000-116,000, and attempting to test the resistance zone of $120,000-125,000 upwards.
The market direction depends on two "shutters":
Positive shutter: ETFs have continued to see net inflows, while the rate of change in holdings of illiquid whales has rebounded, which is expected to break through the upper resistance.
Negative shutter: ETFs turn to net outflows and prices fall below the short-term holder cost line again, which will trigger a pullback to the strong support area of $109,000-110,000.
Medium to long term:
Institutional entry (ETFs, stablecoins, RWAs) and fluctuations in macro nominal interest rates will jointly push Bitcoin's "digital gold" narrative to the forefront, which is the unchanging main line.
In terms of market structure, the moderate allocation of long-term holders and the continued takeover by institutional carriers will enable prices to advance in a step-by-step manner instead of rising unilaterally.
Mid-term exploration
Liquidity Supply
BTC exchange trend net position
Total stablecoin supply
USDC purchasing power comprehensive score
Whale comprehensive score
(Liquidity Supply in the Figure Below)
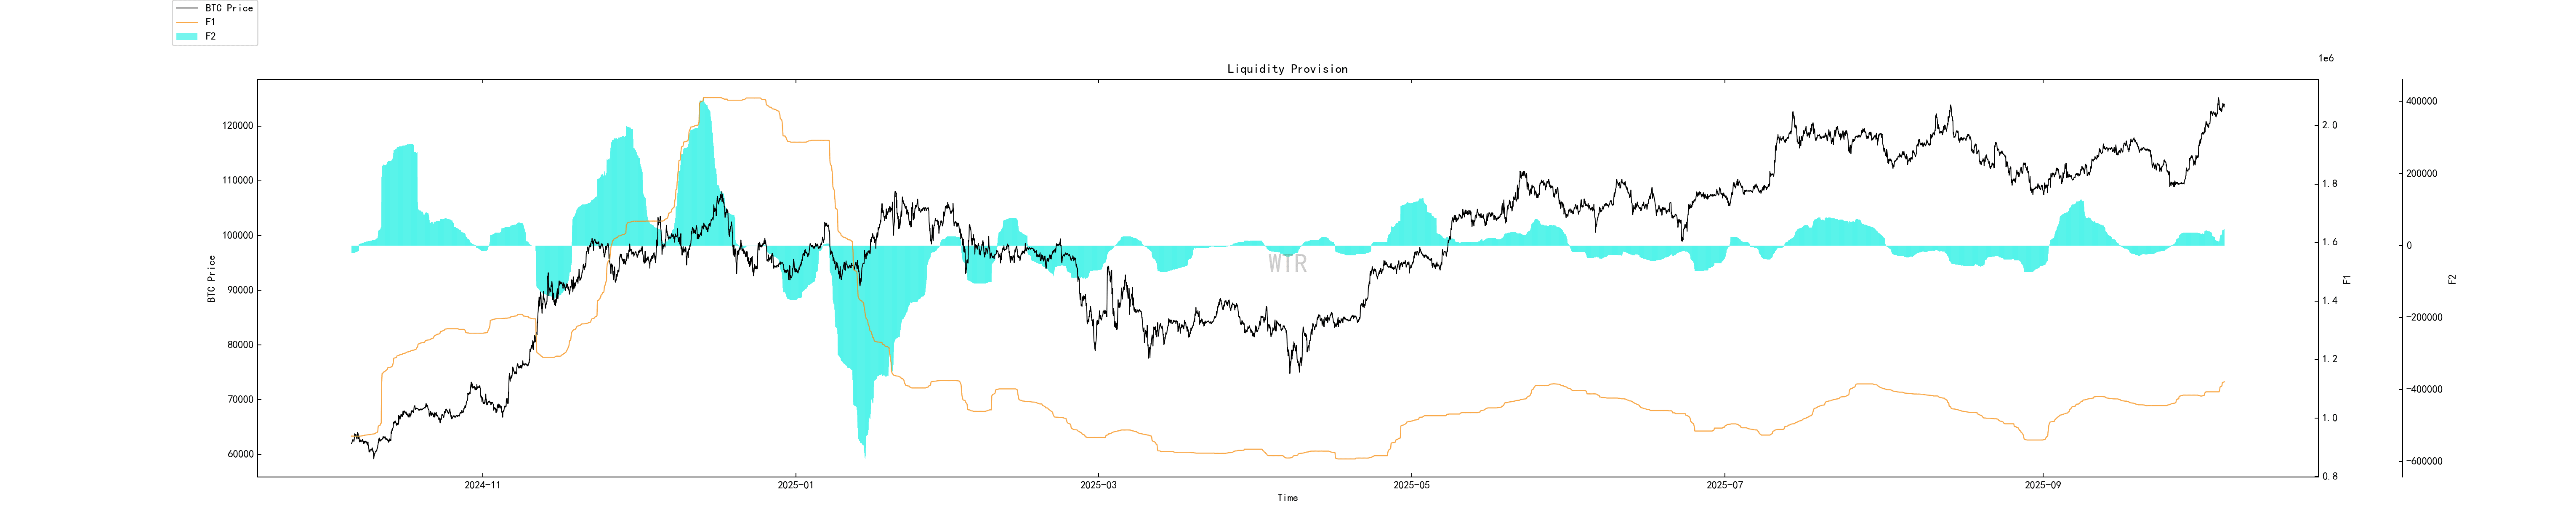
The liquidity supply is currently growing at a slower rate, but it is not declining as it would be in a downturn.
The current liquidity growth is relatively slow, and the pace in the market may also be neither fast nor slow.
(Figure below shows the trend of BTC exchange net positions)
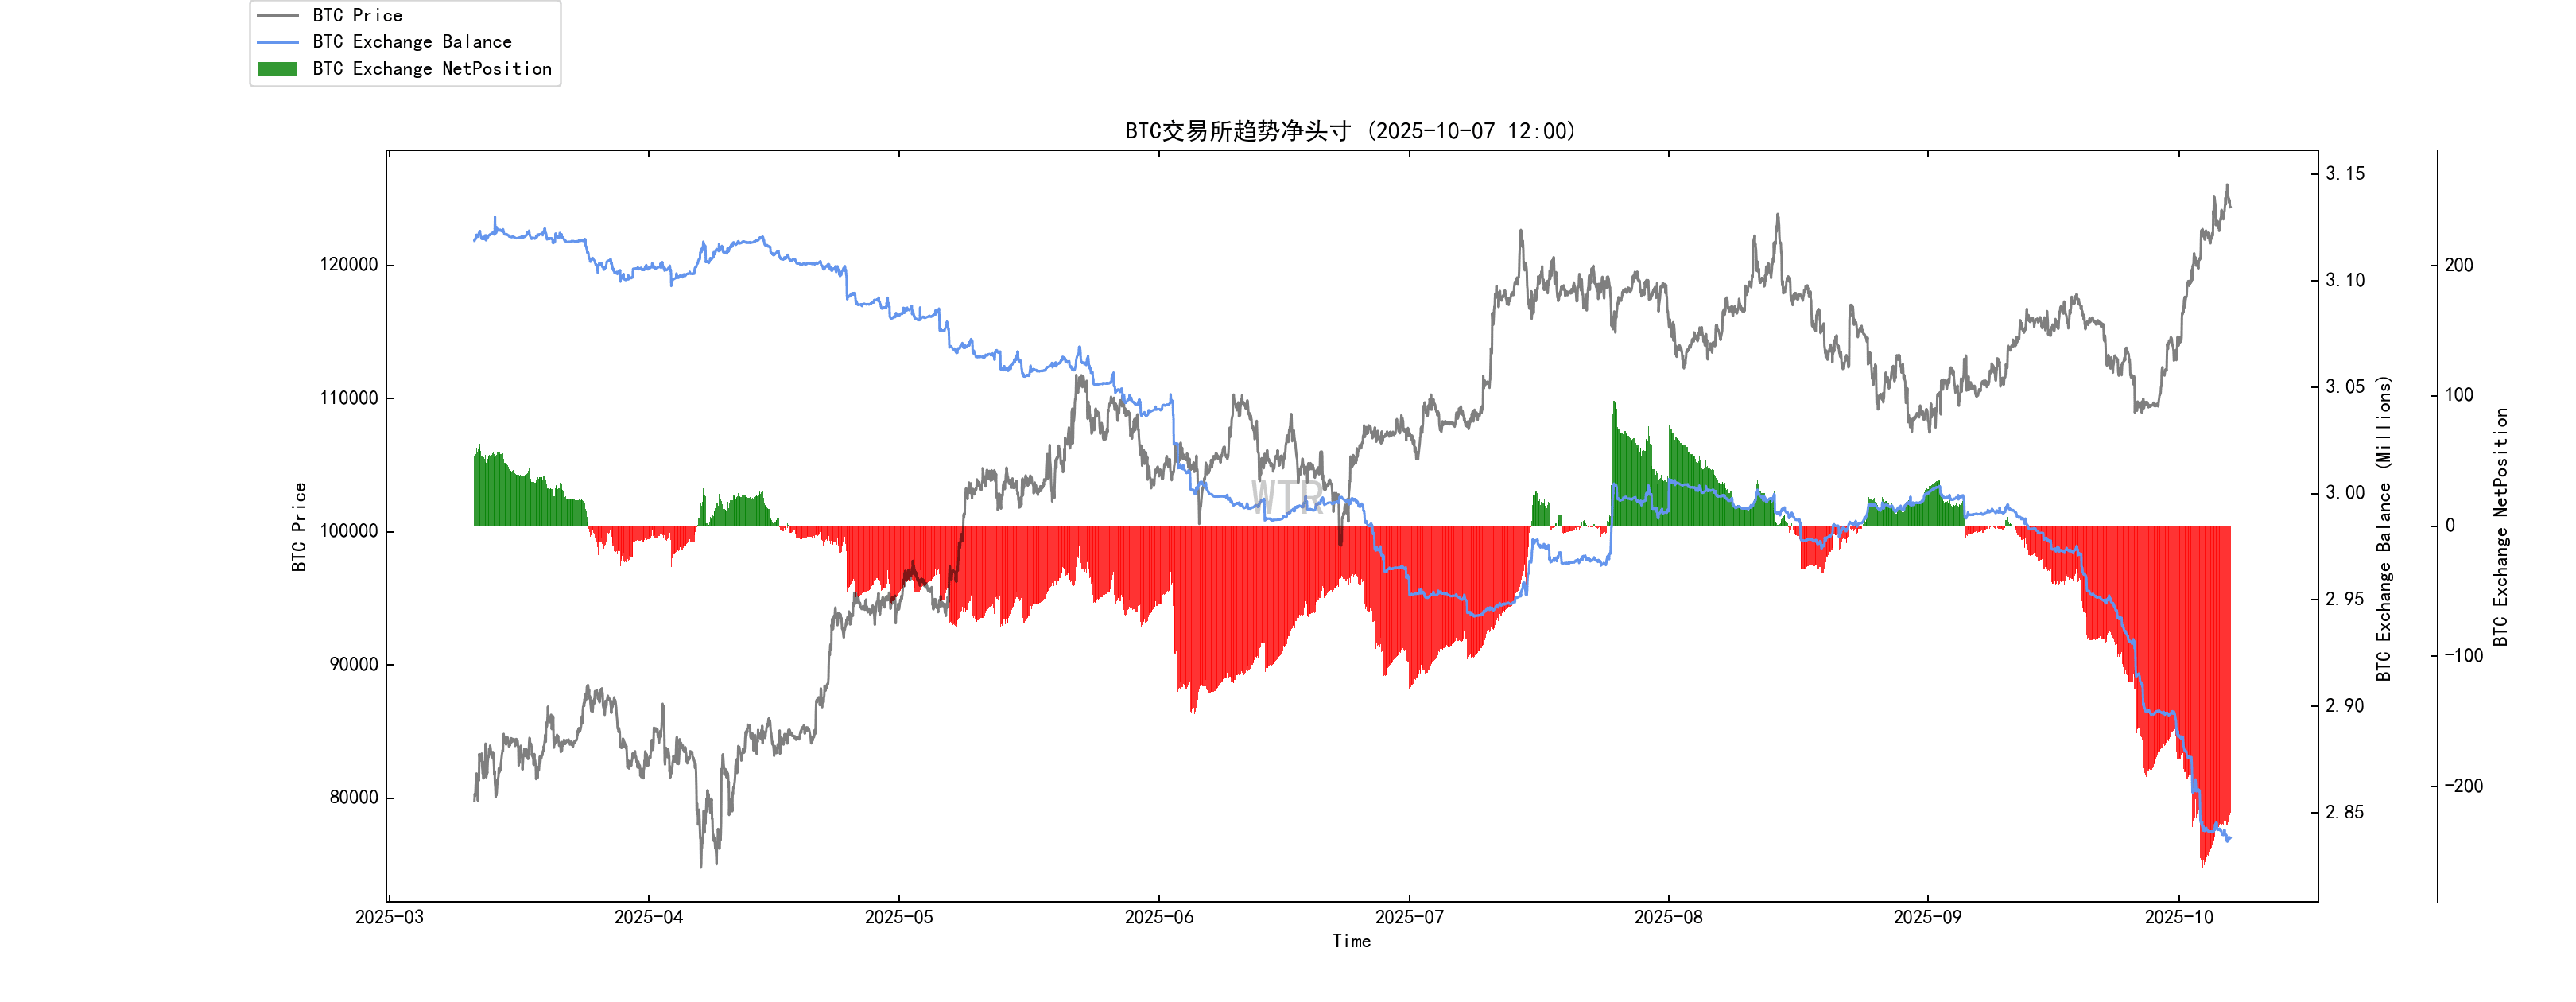
The speed of massive outflow from exchanges has slowed down, and the current acceleration phenomenon in the market may be facing a deceleration, or the market is slowly finding rational boundaries and returning to a neutral participation rhythm.
(Figure below shows the total supply of stablecoins)
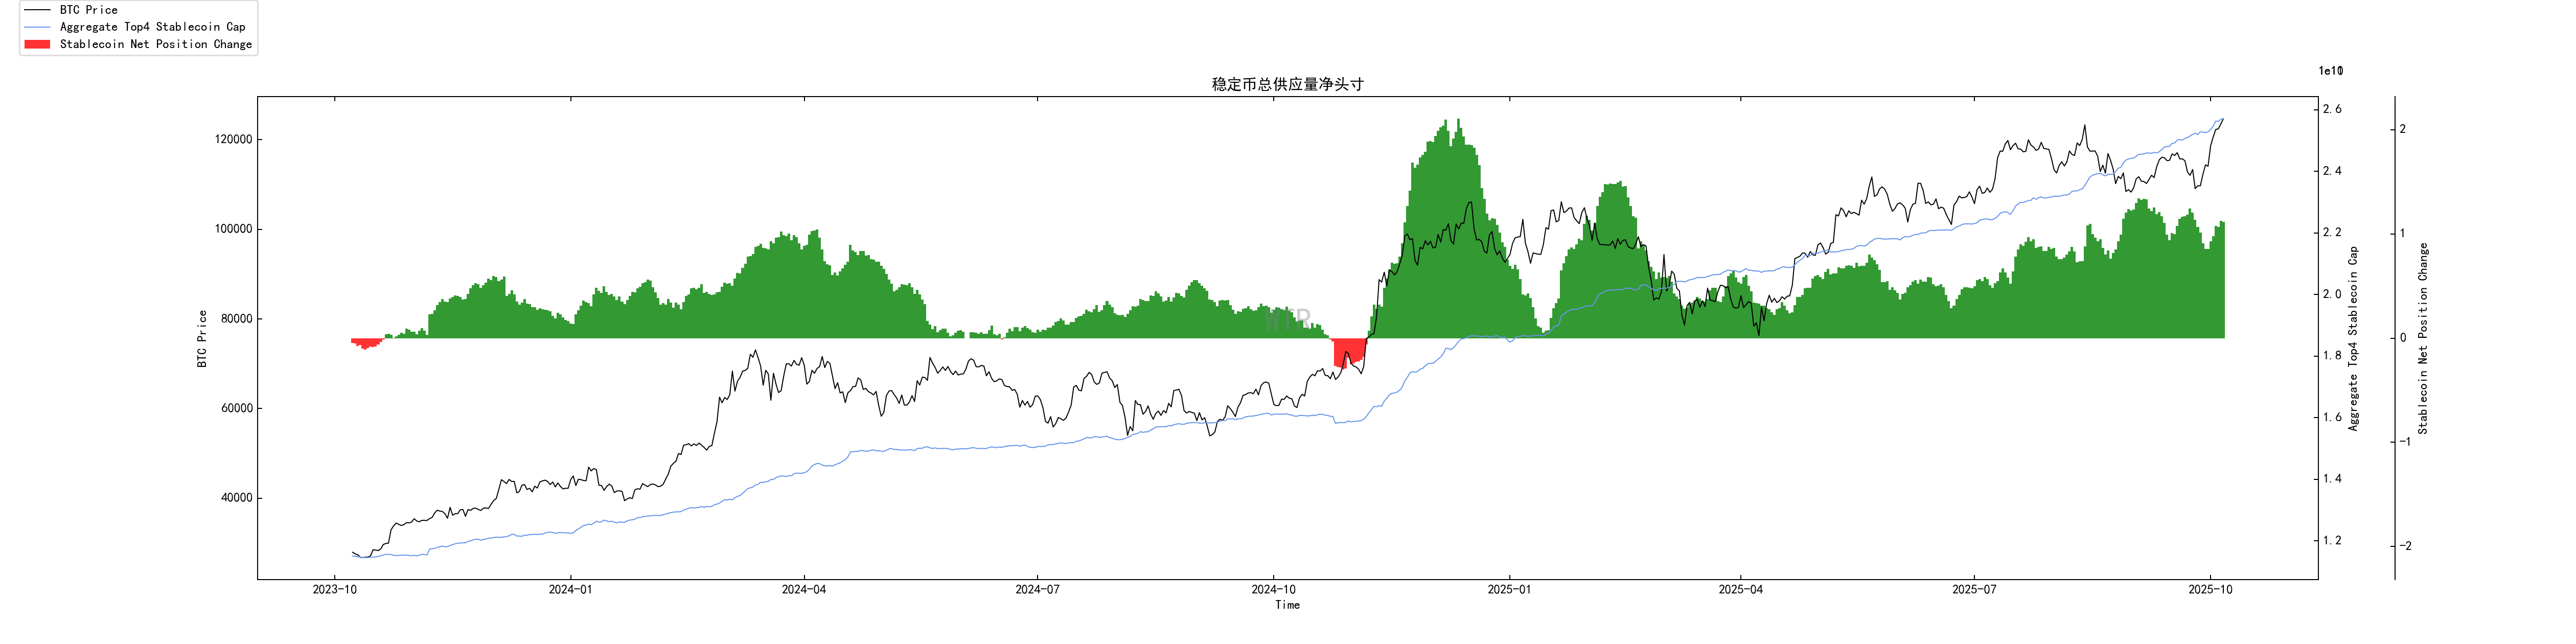
The supply of stablecoins continues to grow slowly on an annual basis, and the current growth rate of stablecoins hovers between large and small growth.
If the risks in the market are not truly opened up, it may not affect the current growth.
Moderate growth is the source of indirect momentum in the market.
(USDC purchasing power comprehensive score in the figure below)
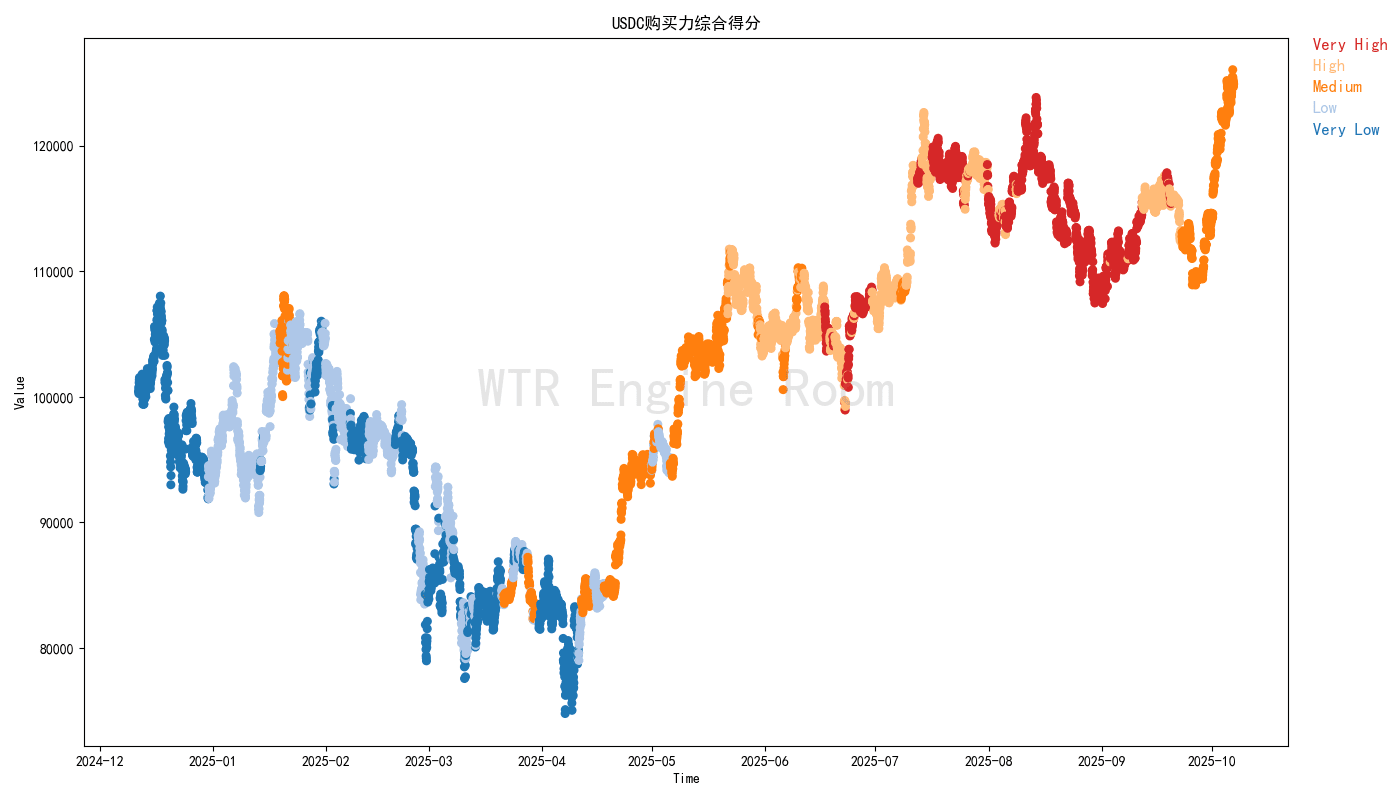
USDC users maintain a neutral participation attitude.
The current purchasing power status in the market may only need to be considered in terms of sustainability.
(Below: Whale Comprehensive Scoring Model)
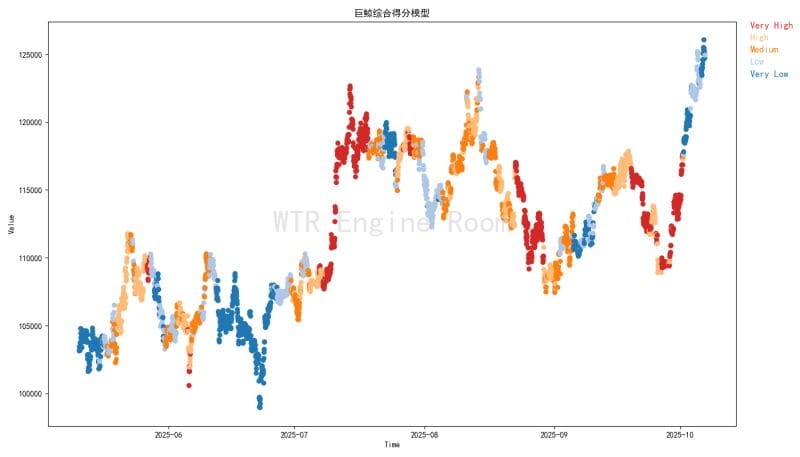
The whales chose to sell after the market rose, and they may be anxious about making profits at the moment.
The baton of the market may still need to rely on funds flowing into the off-market.
Short-term observation
Derivatives risk factor
Option intention transaction ratio
Derivatives trading volume
Option implied volatility
Profit and loss transfer
New addresses and active addresses
Net position of Bingtang Orange Exchange
Net position on the Yitai exchange
High-weight selling pressure
Global purchasing power status
Stablecoin exchange net positions
Derivatives rating: The risk factor is in the neutral area and the derivatives risk is moderate.
(Figure below: Derivatives Risk Factor)
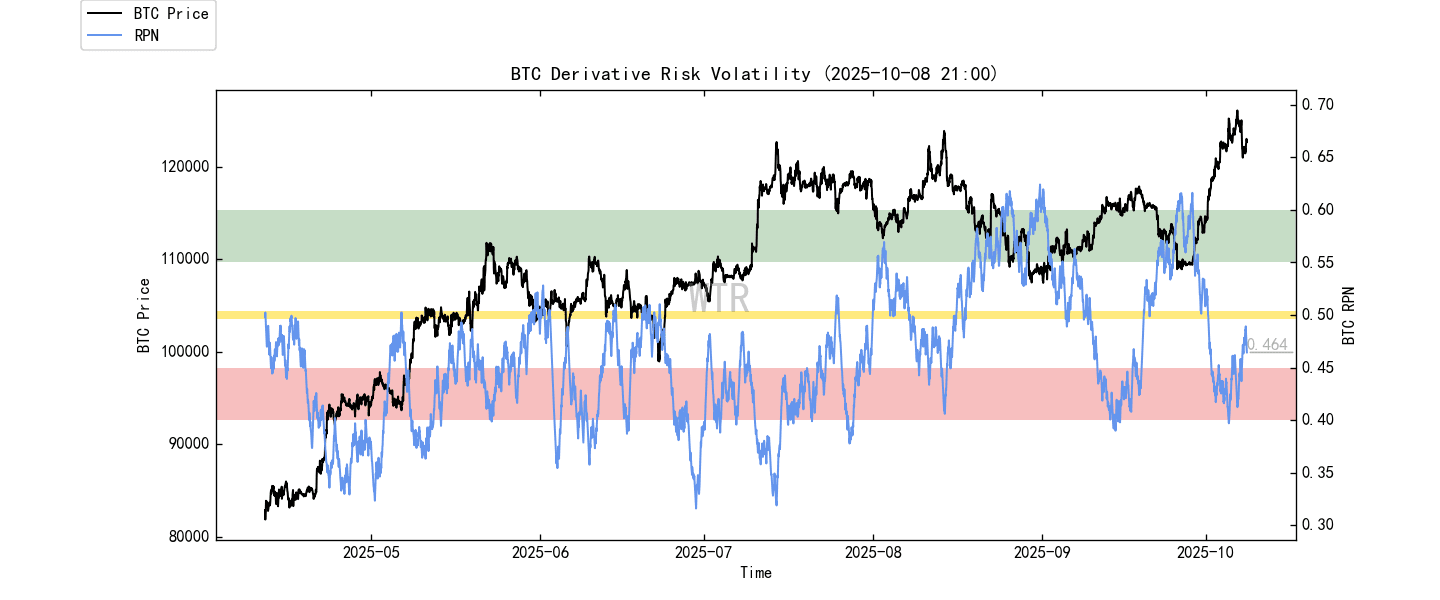
The market finally ended its more than month-long volatile pattern, opting for a rapid rally and short squeeze last week. Judging by the current derivatives risk factors, this short squeeze has concluded.
(Figure below shows option intention-to-trade ratio)
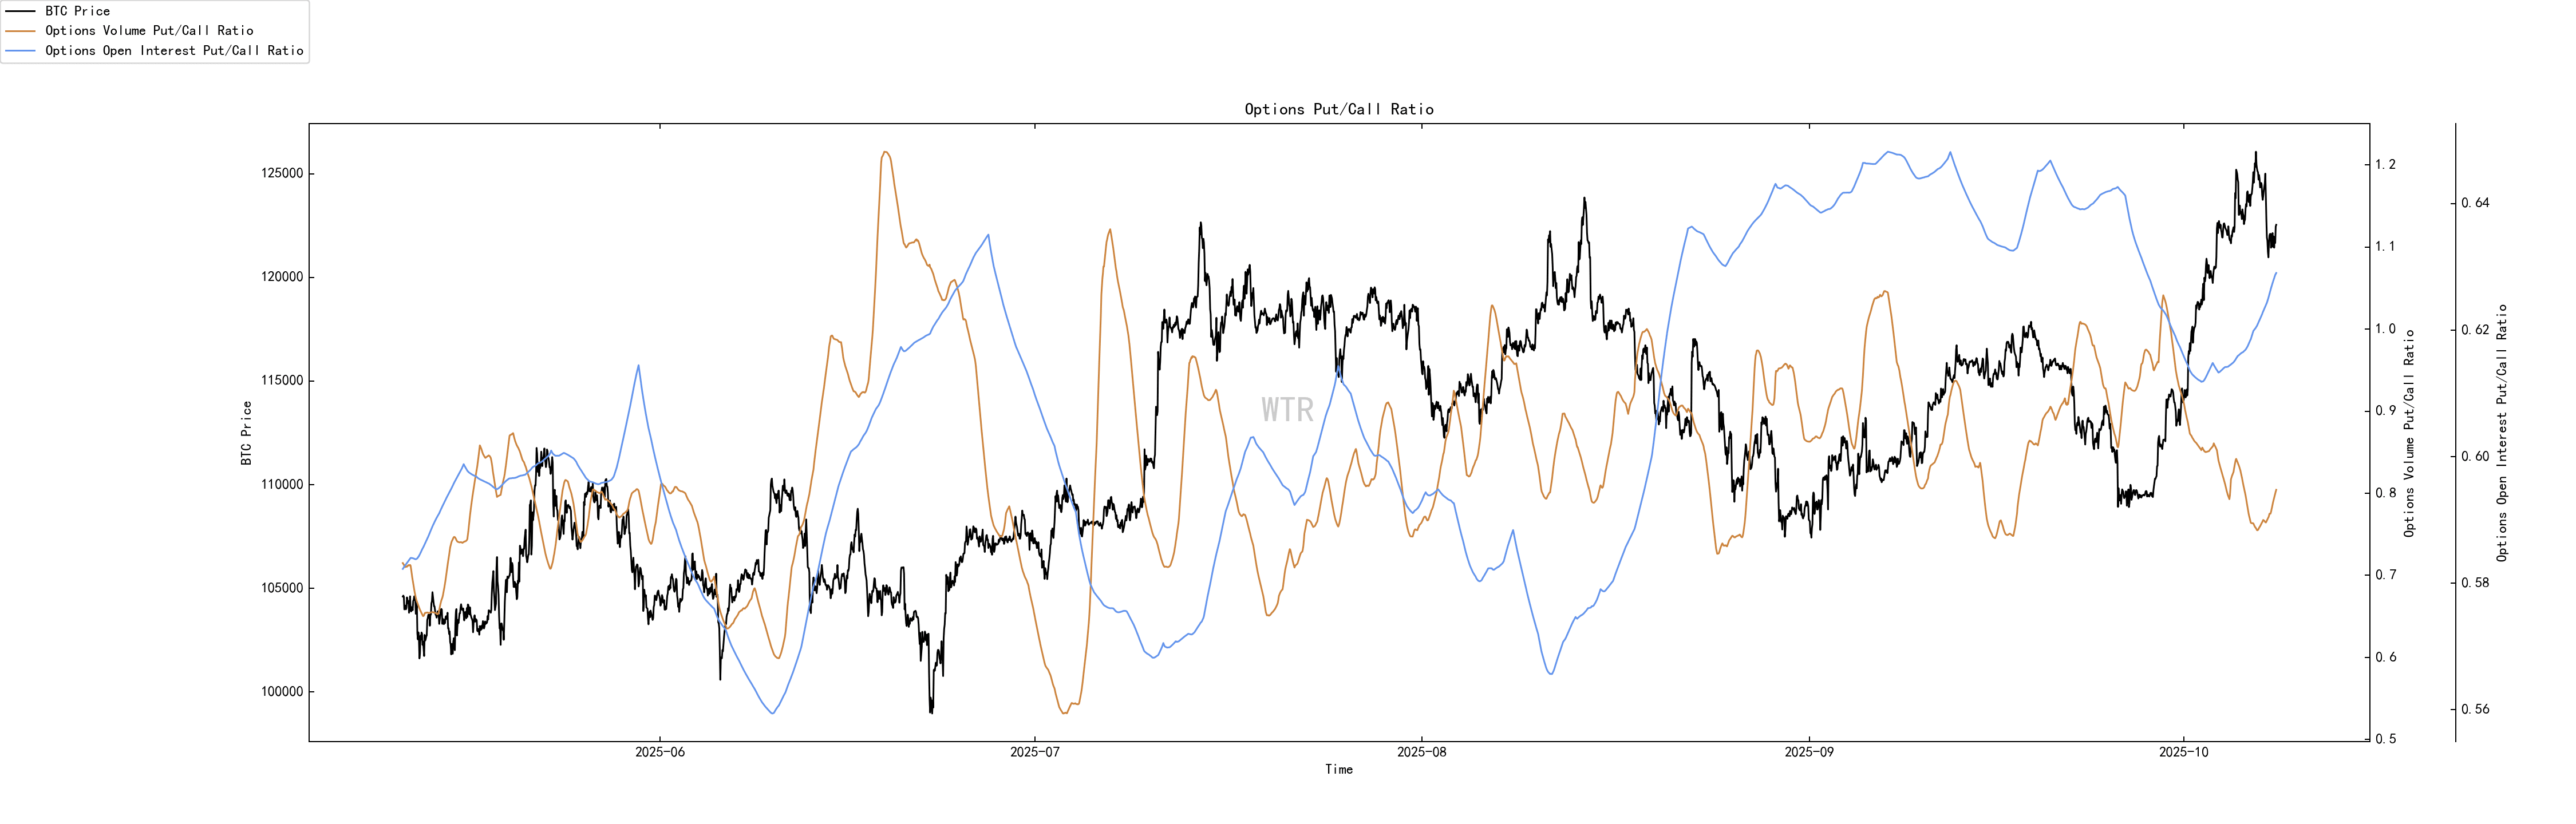
The proportion of put options has dropped slightly, but is generally at a medium-high level.
(Figure below: Derivatives trading volume)
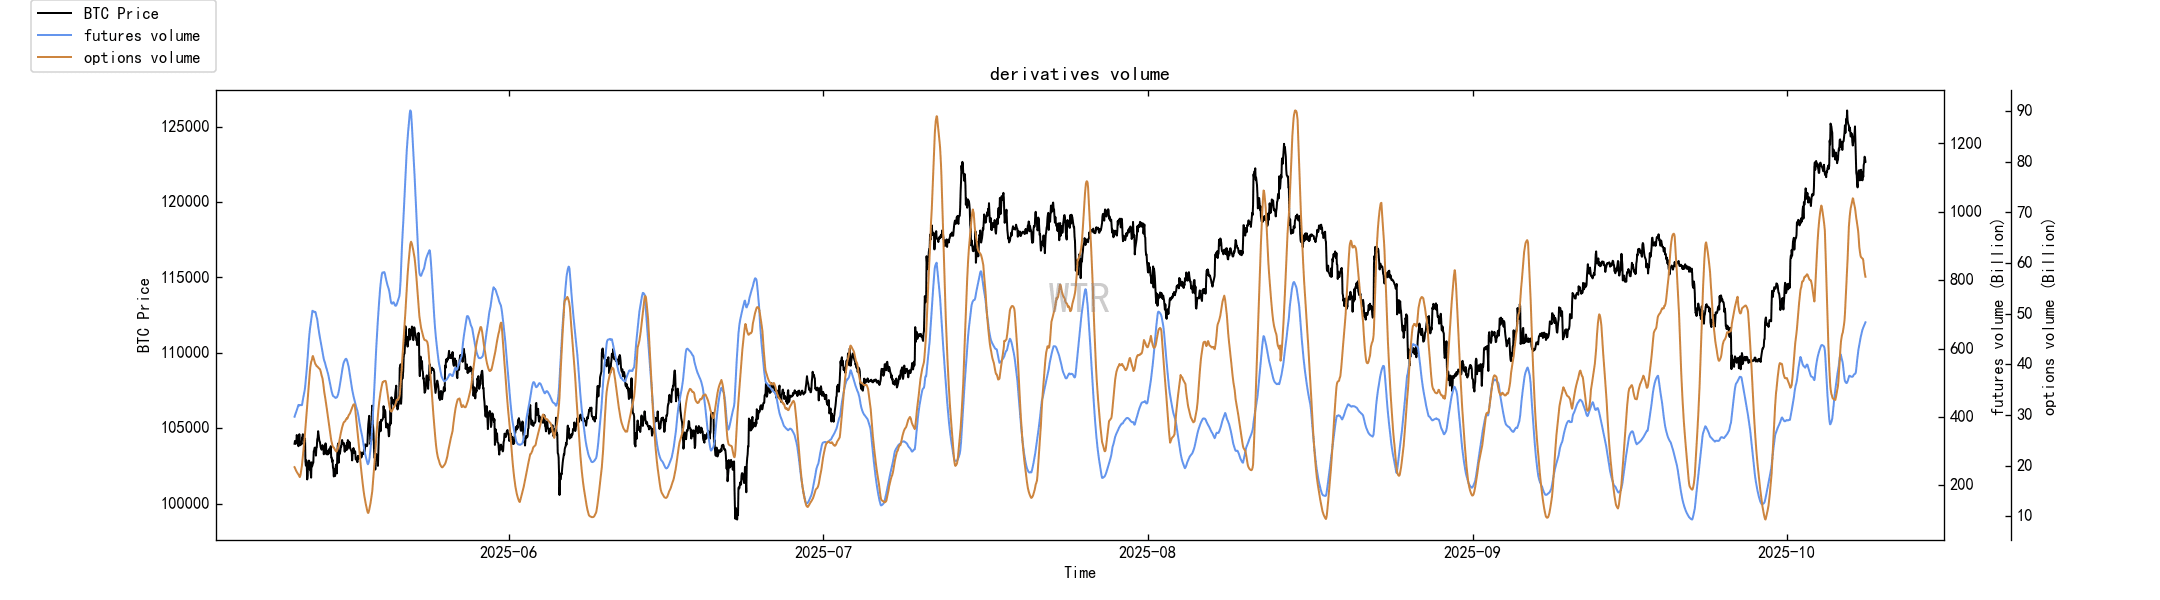
Derivatives trading volumes are currently at a medium-to-high level.
(The figure below shows option implied volatility)
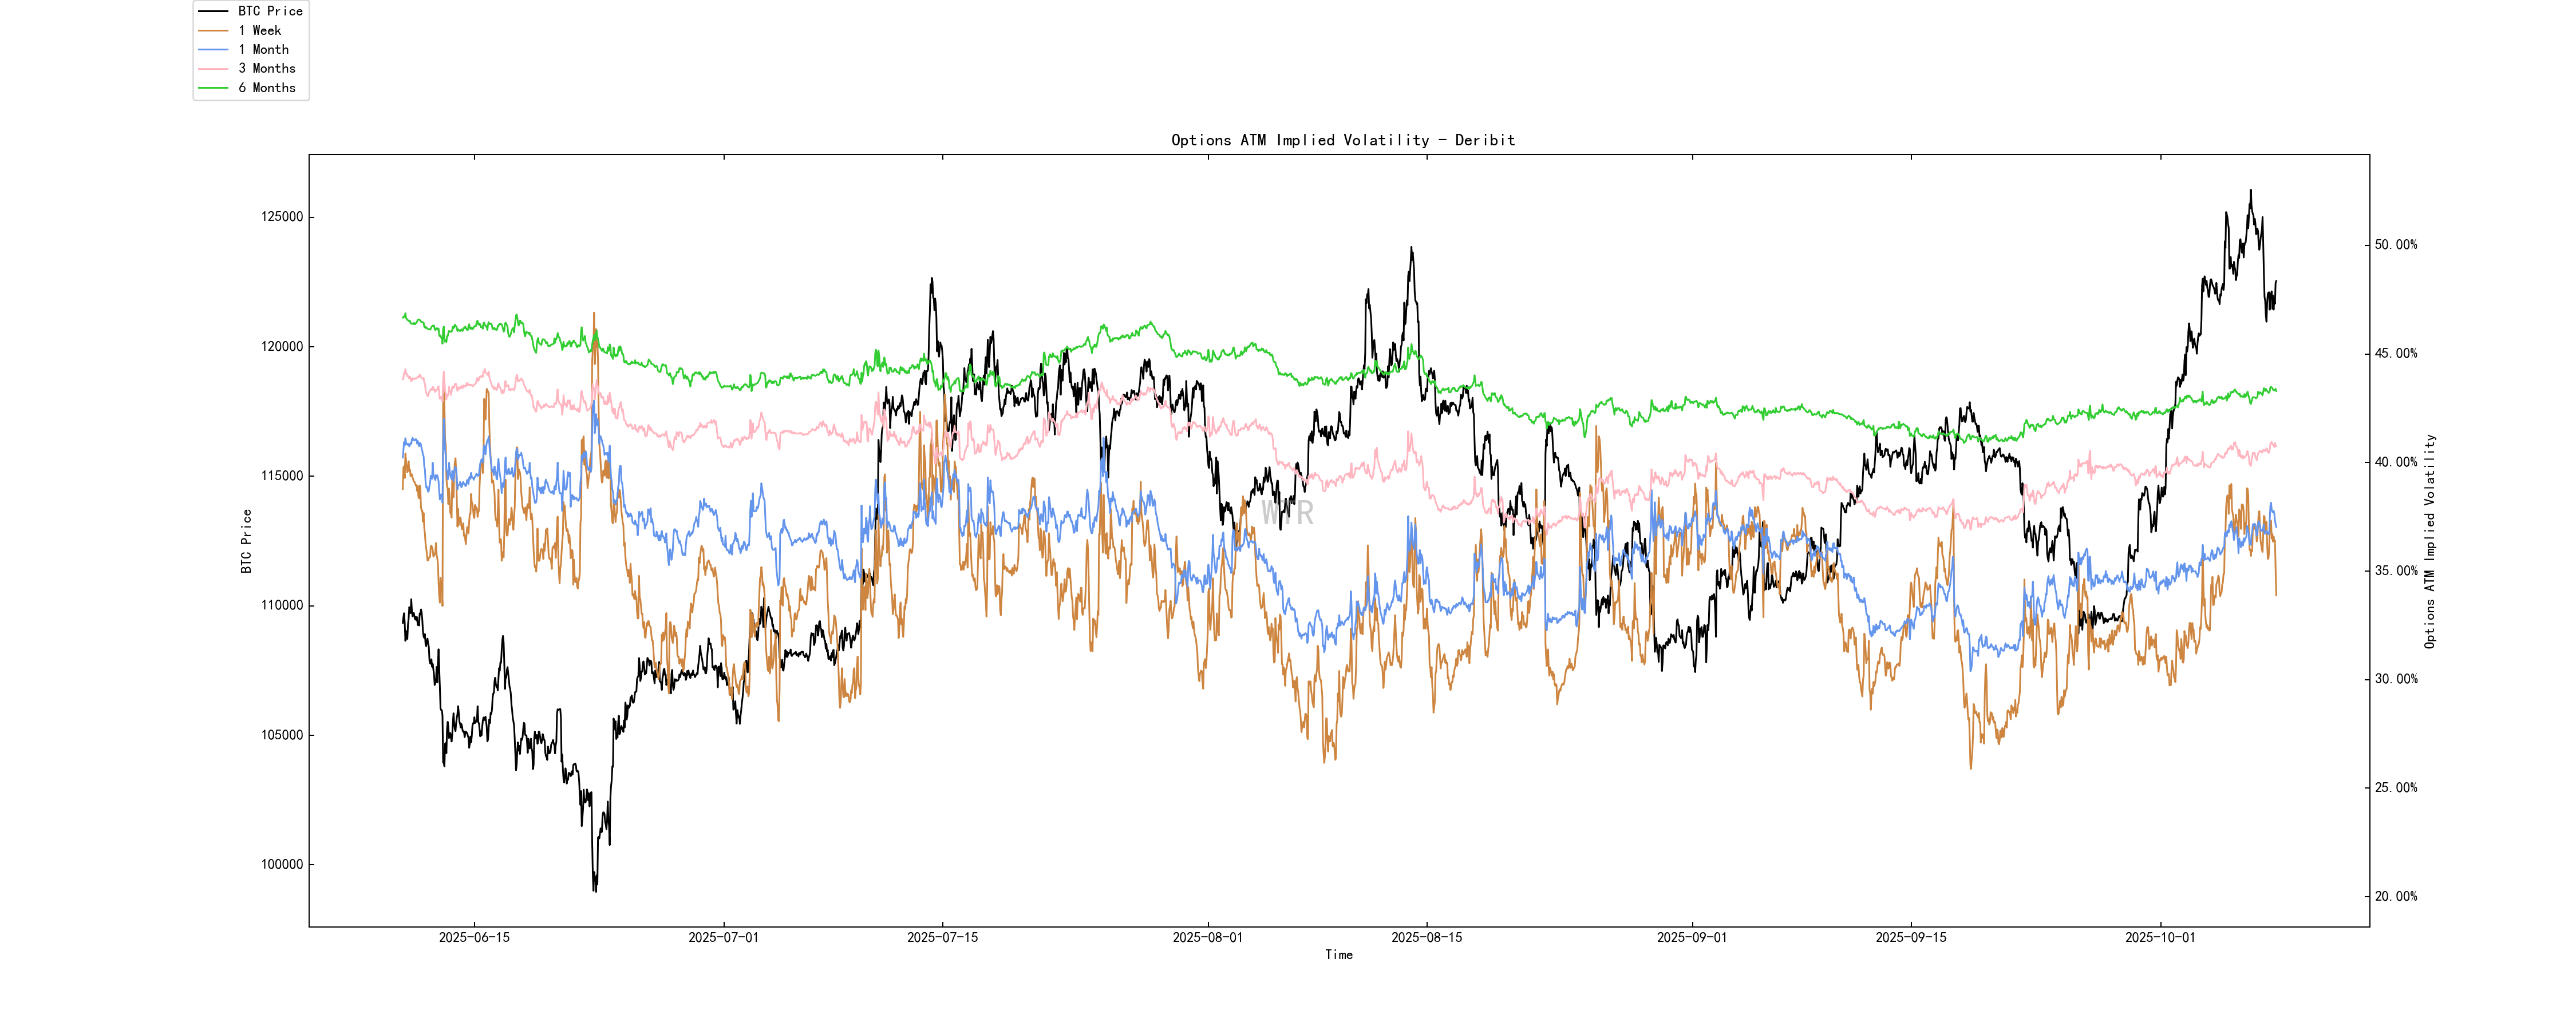
The implied volatility of options fluctuates rapidly in the short term as the market rises.
Mood state rating: Optimistic
(The figure below shows the amount of profit and loss transfer)
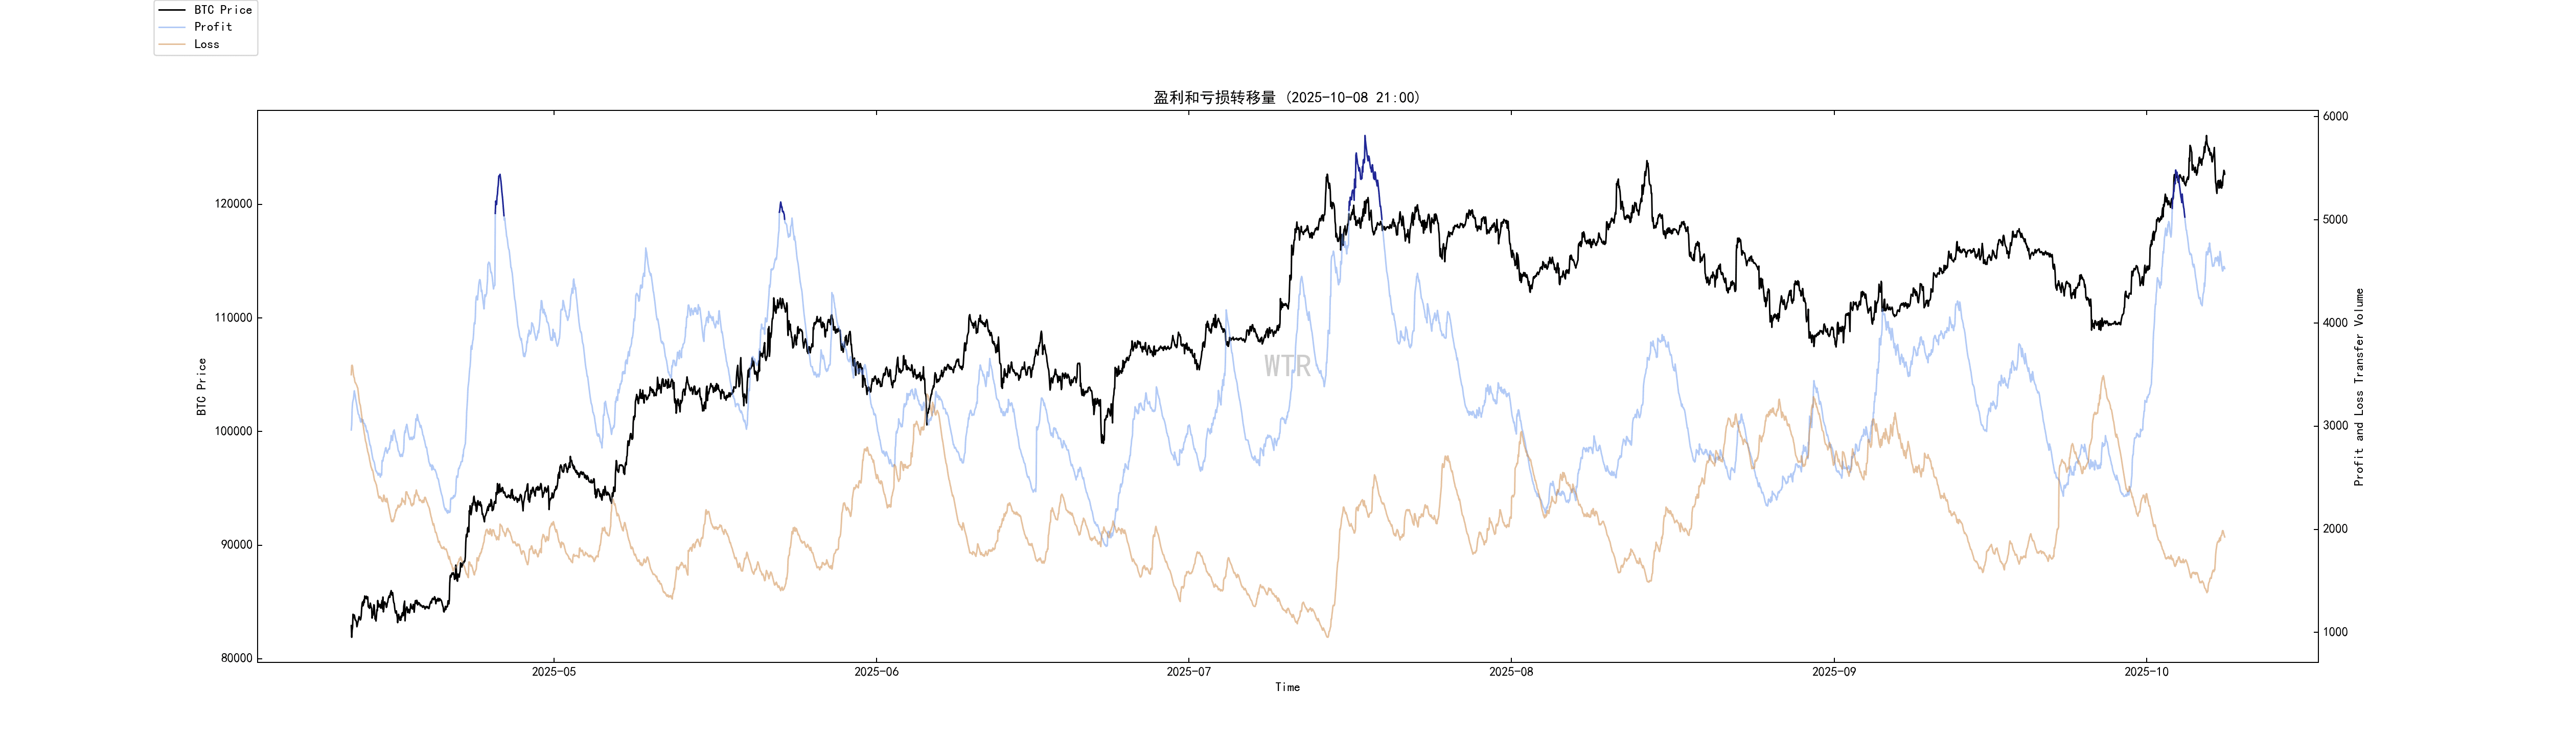
Last week, the market's positive sentiment briefly touched the optimistic zone (market sentiment is between neutral and greedy).
The current positive market sentiment has slightly declined. Also attached is last week's analysis.
In fact, judging by the chip chart, the accumulated profit-taking during this cycle has been minimal, and there has been little panic selling of losing chips, suggesting that market participants are becoming more cautious. While this is a positive development, it means lower market volatility, and a negative development, it suggests that future gains may be limited.
(Figure below shows newly added addresses and active addresses)
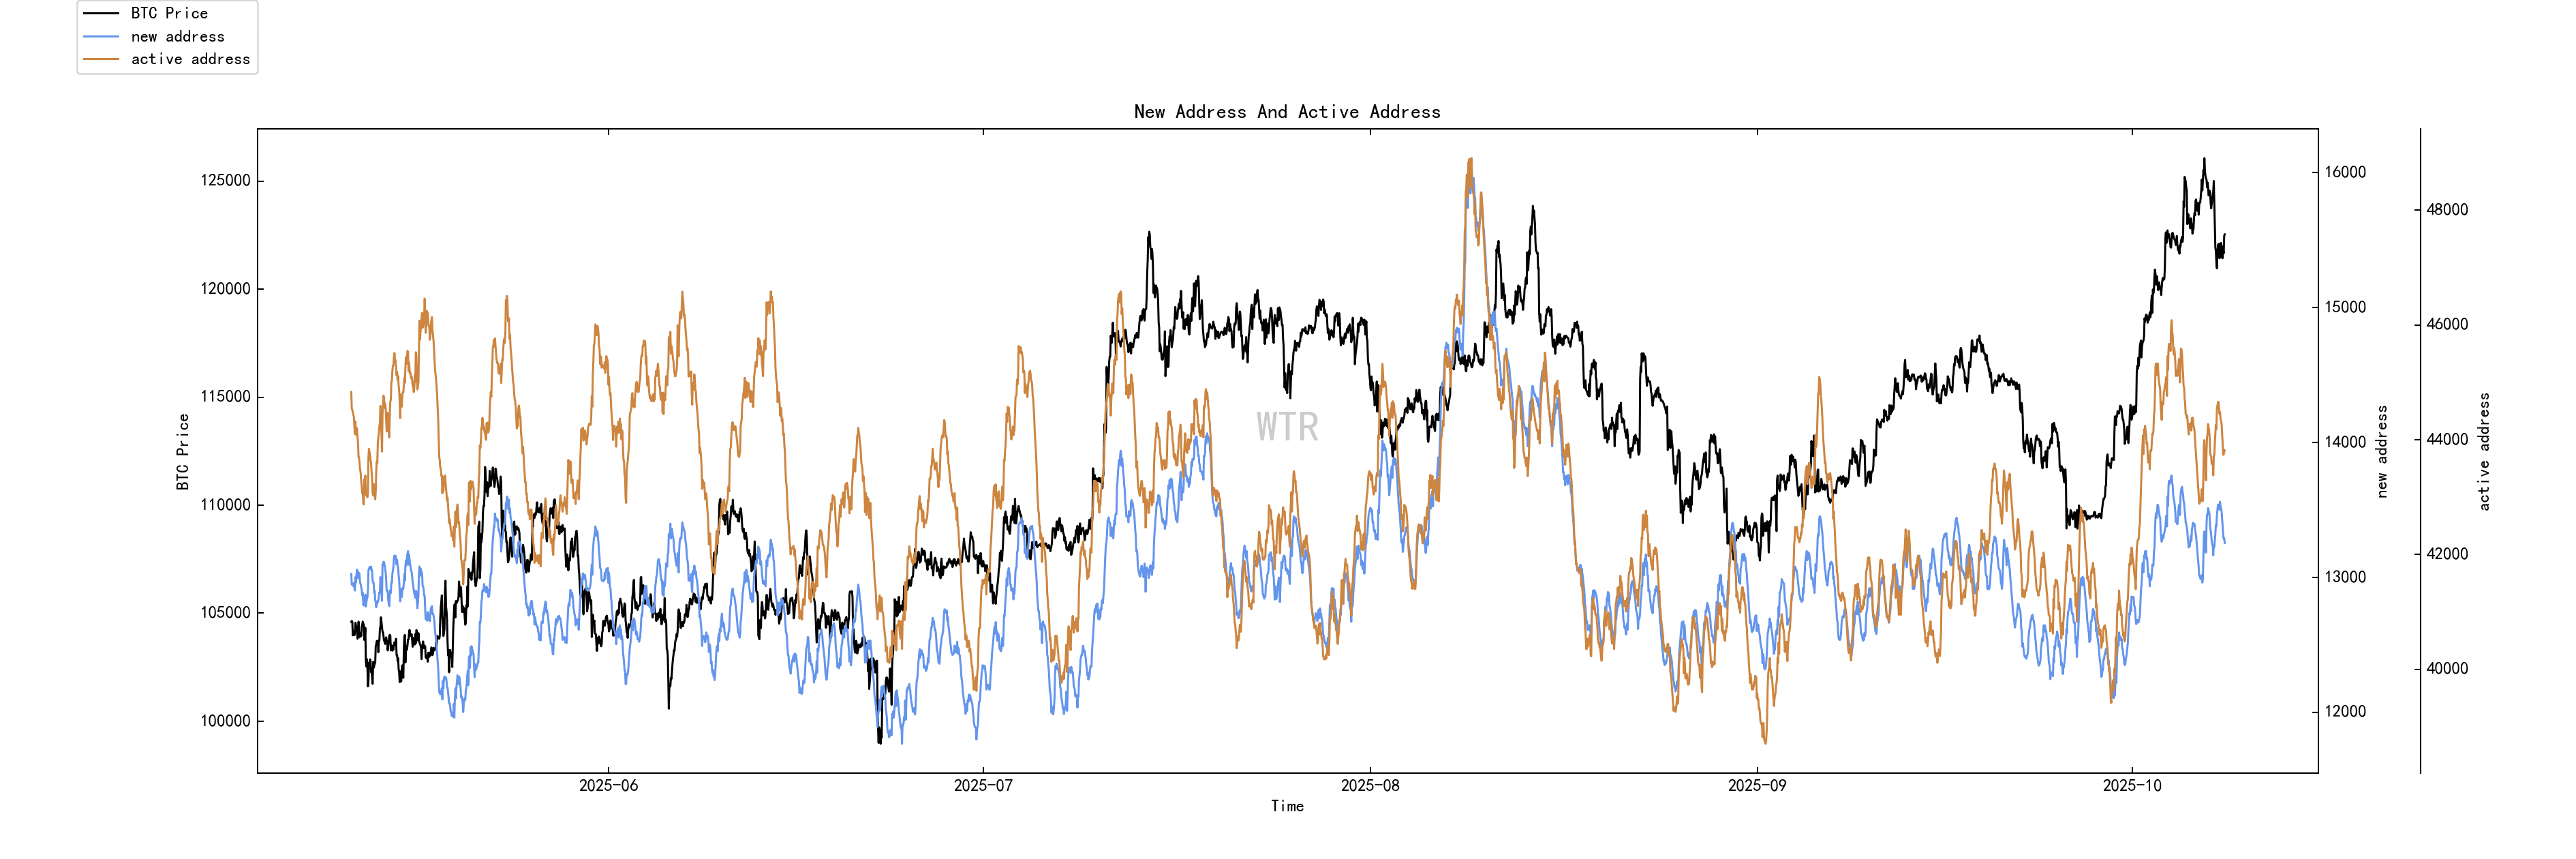
New active addresses are added to the mid-to-low range.
Spot and selling pressure structure rating: Both BTC and ETH have moderate outflows.
(Figure below: Net position of Bingtang Orange Exchange)
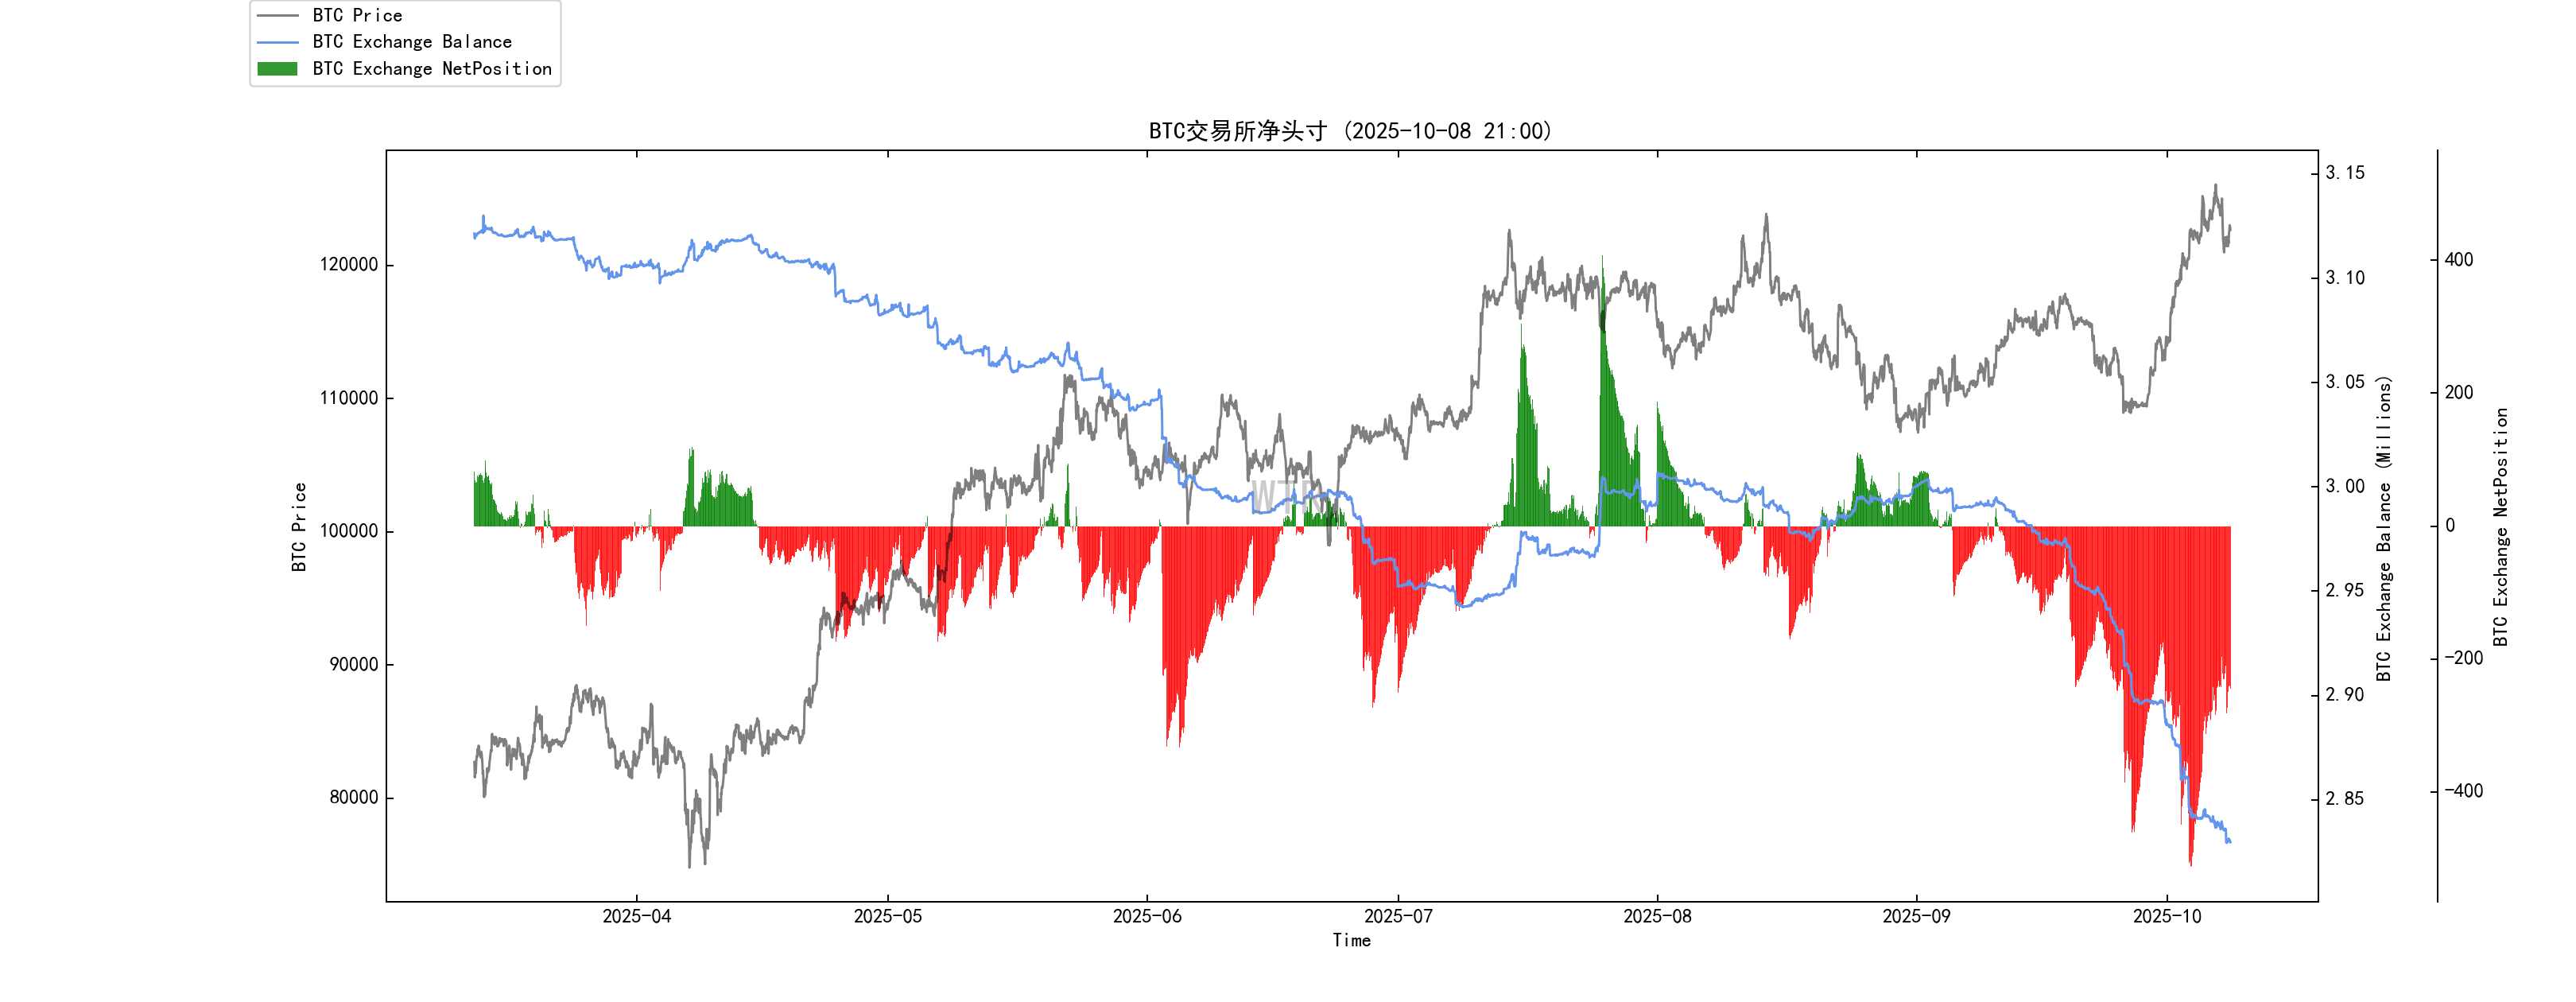
Last week, the overall BTC net position on exchanges was in a moderate outflow state. Compared with the previous week, the outflow has slowed down.
(Figure below: Net position of E-Exchange)
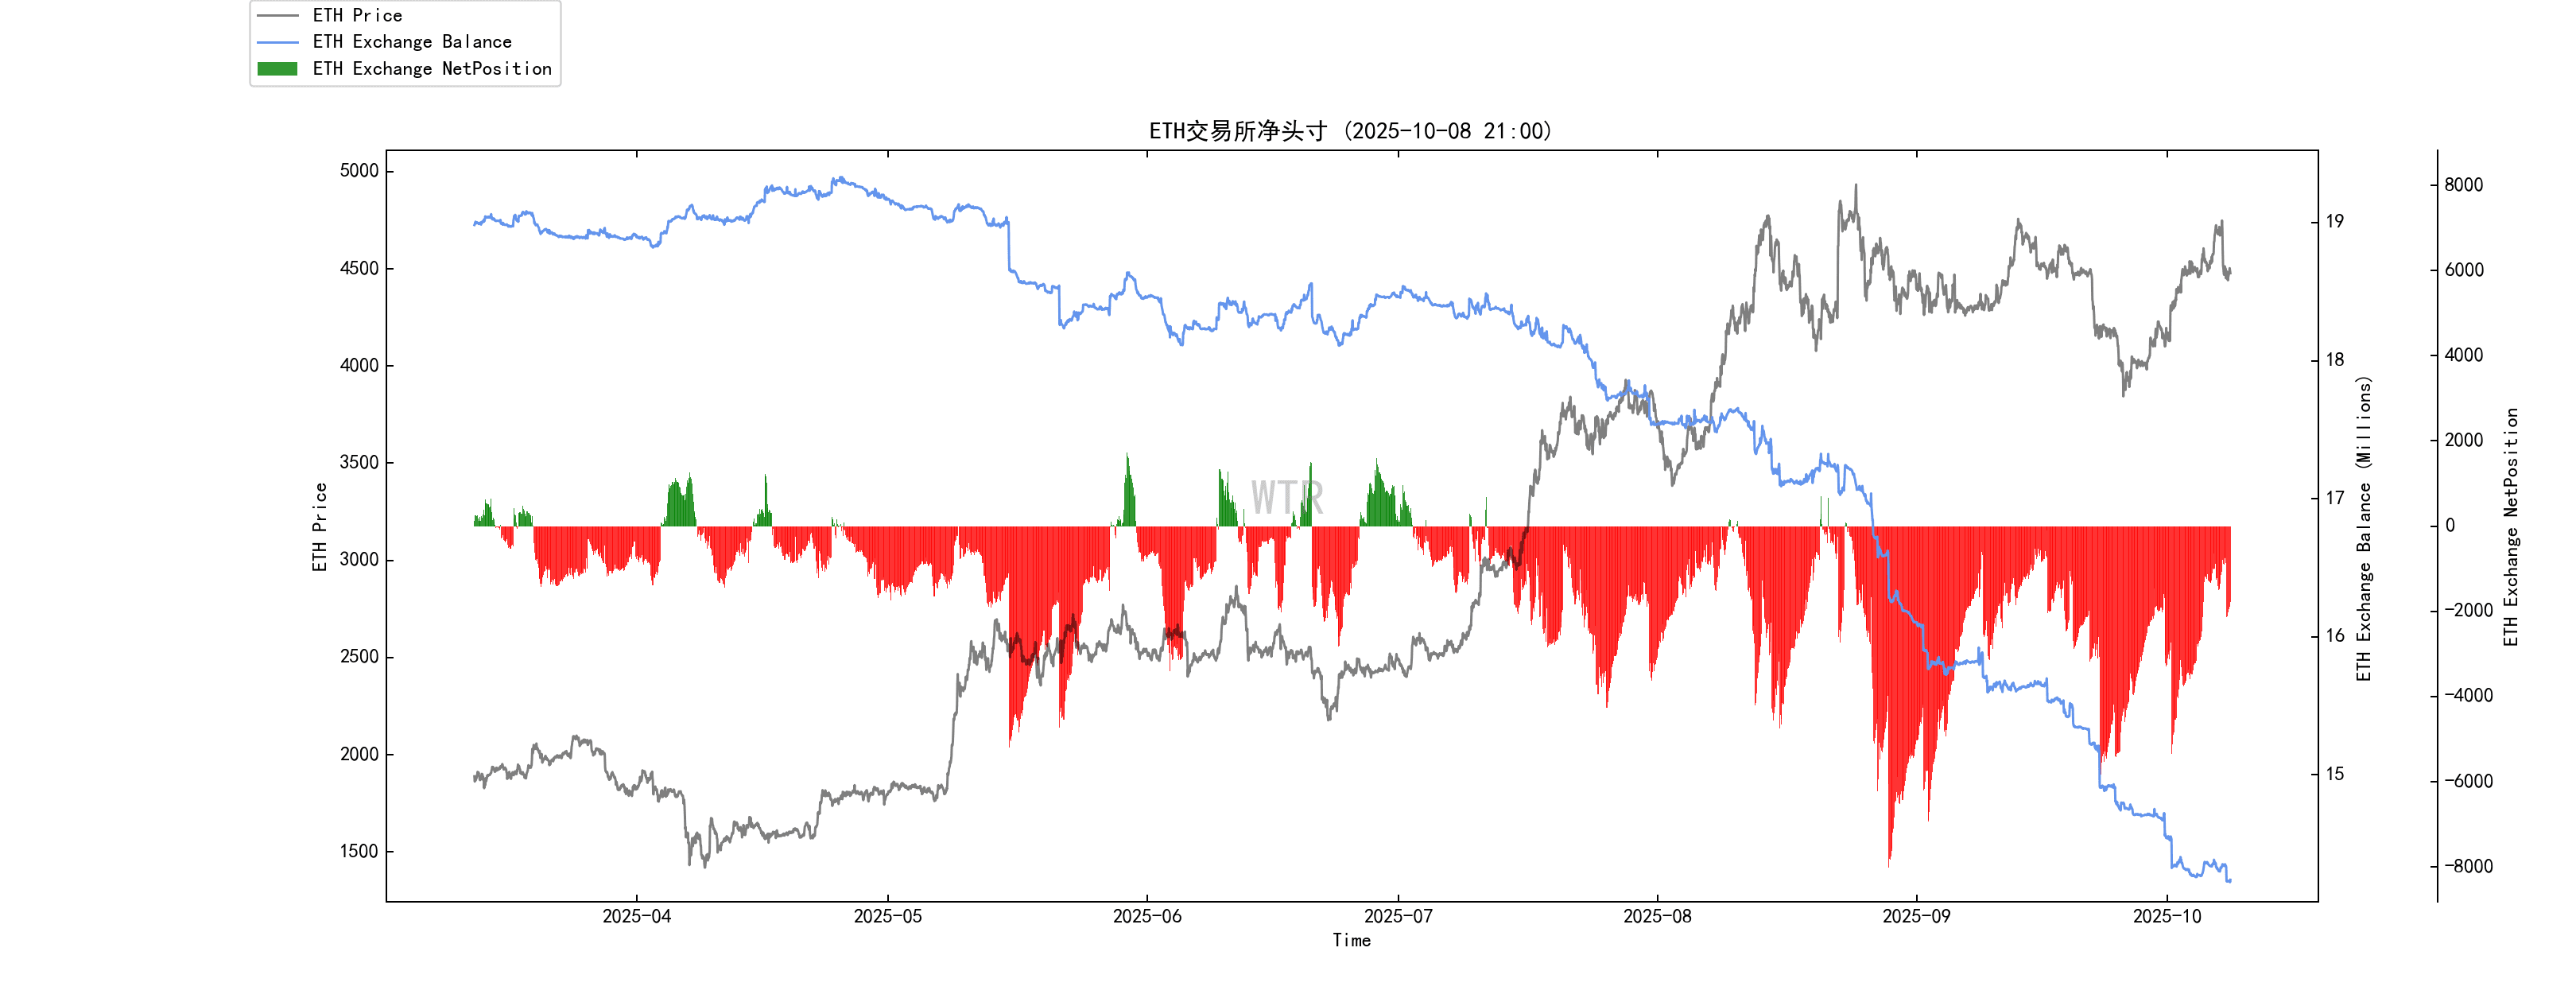
The situation with ETH is the same as that with BTC.
(Figure below shows high-weight selling pressure)
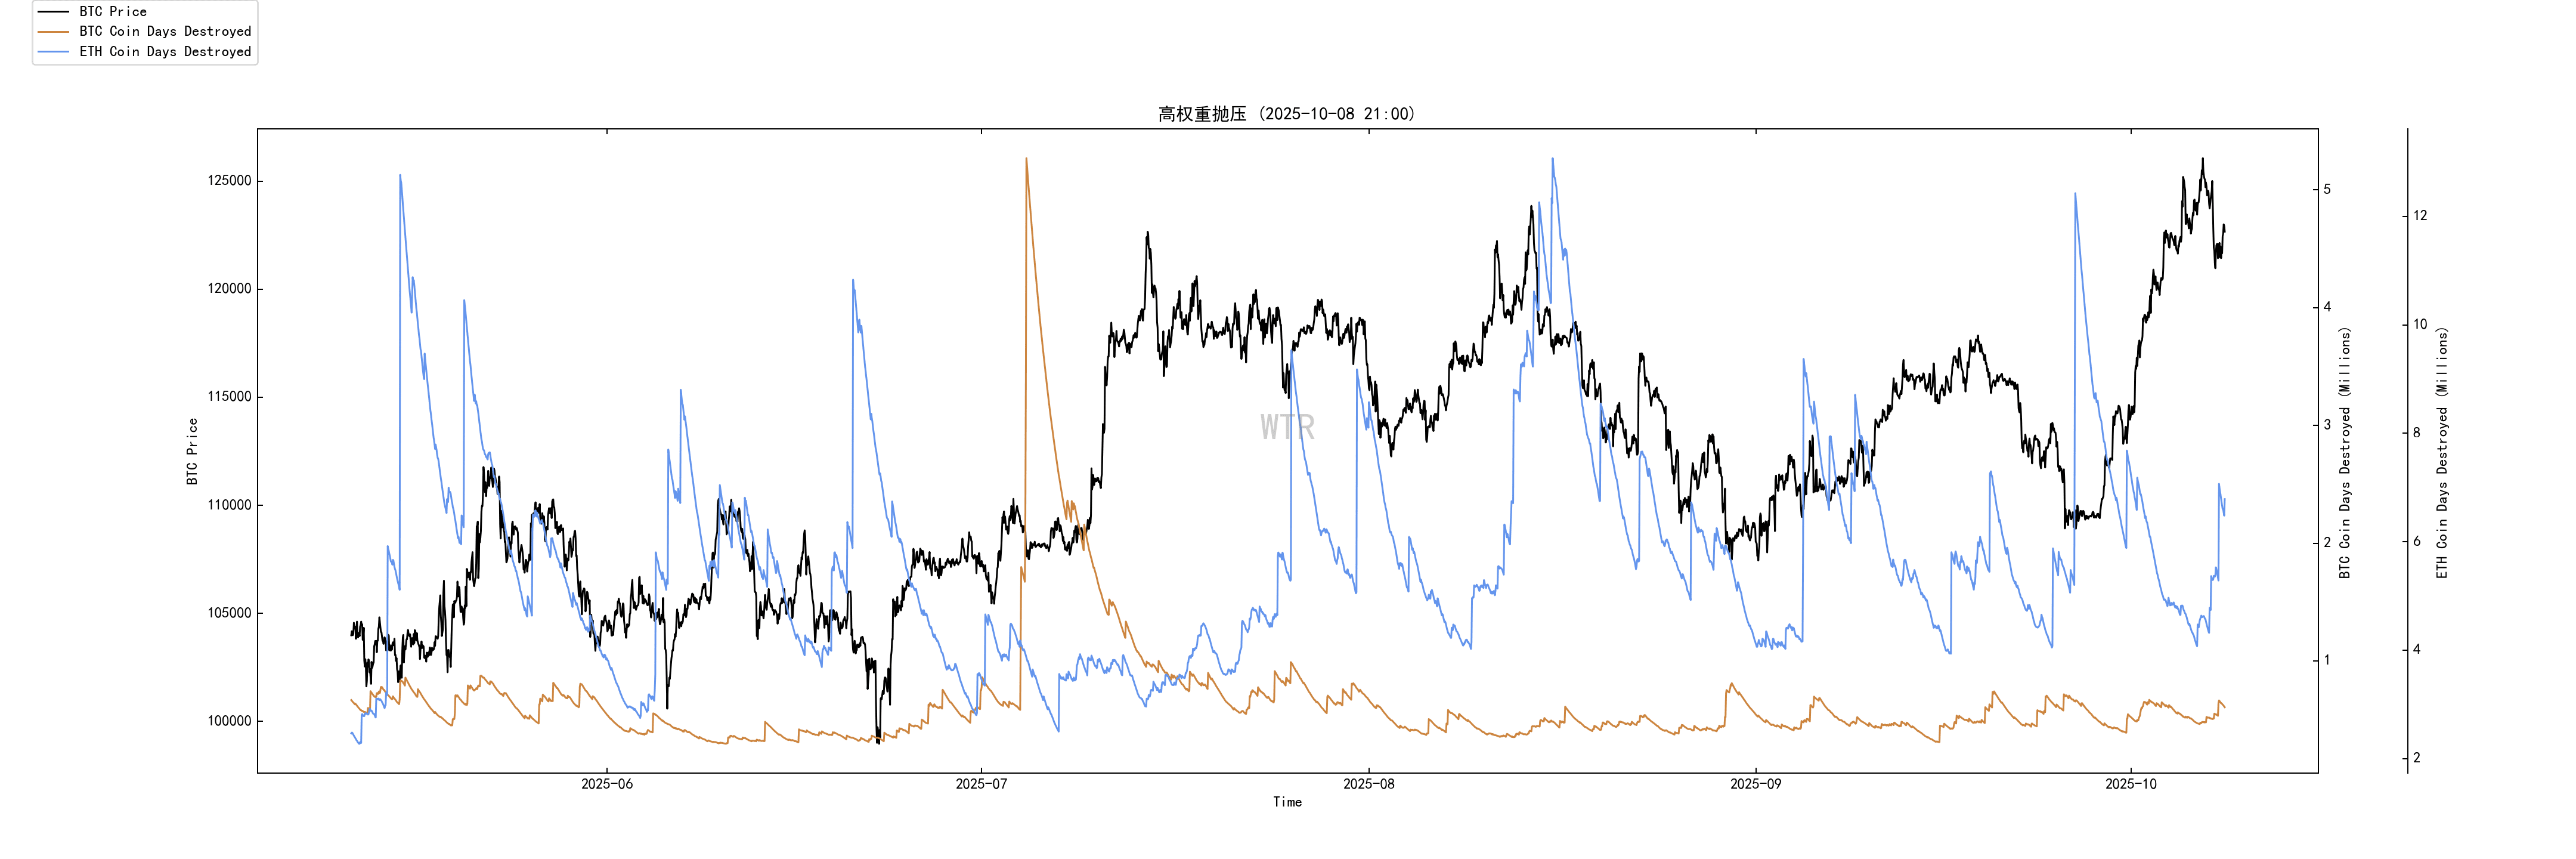
ETH has a small amount of high-weight selling pressure.
Purchasing power rating: Global purchasing power has rebounded moderately, and the purchasing power of stablecoins has remained the same compared to last week.
(Figure below: Global purchasing power status)
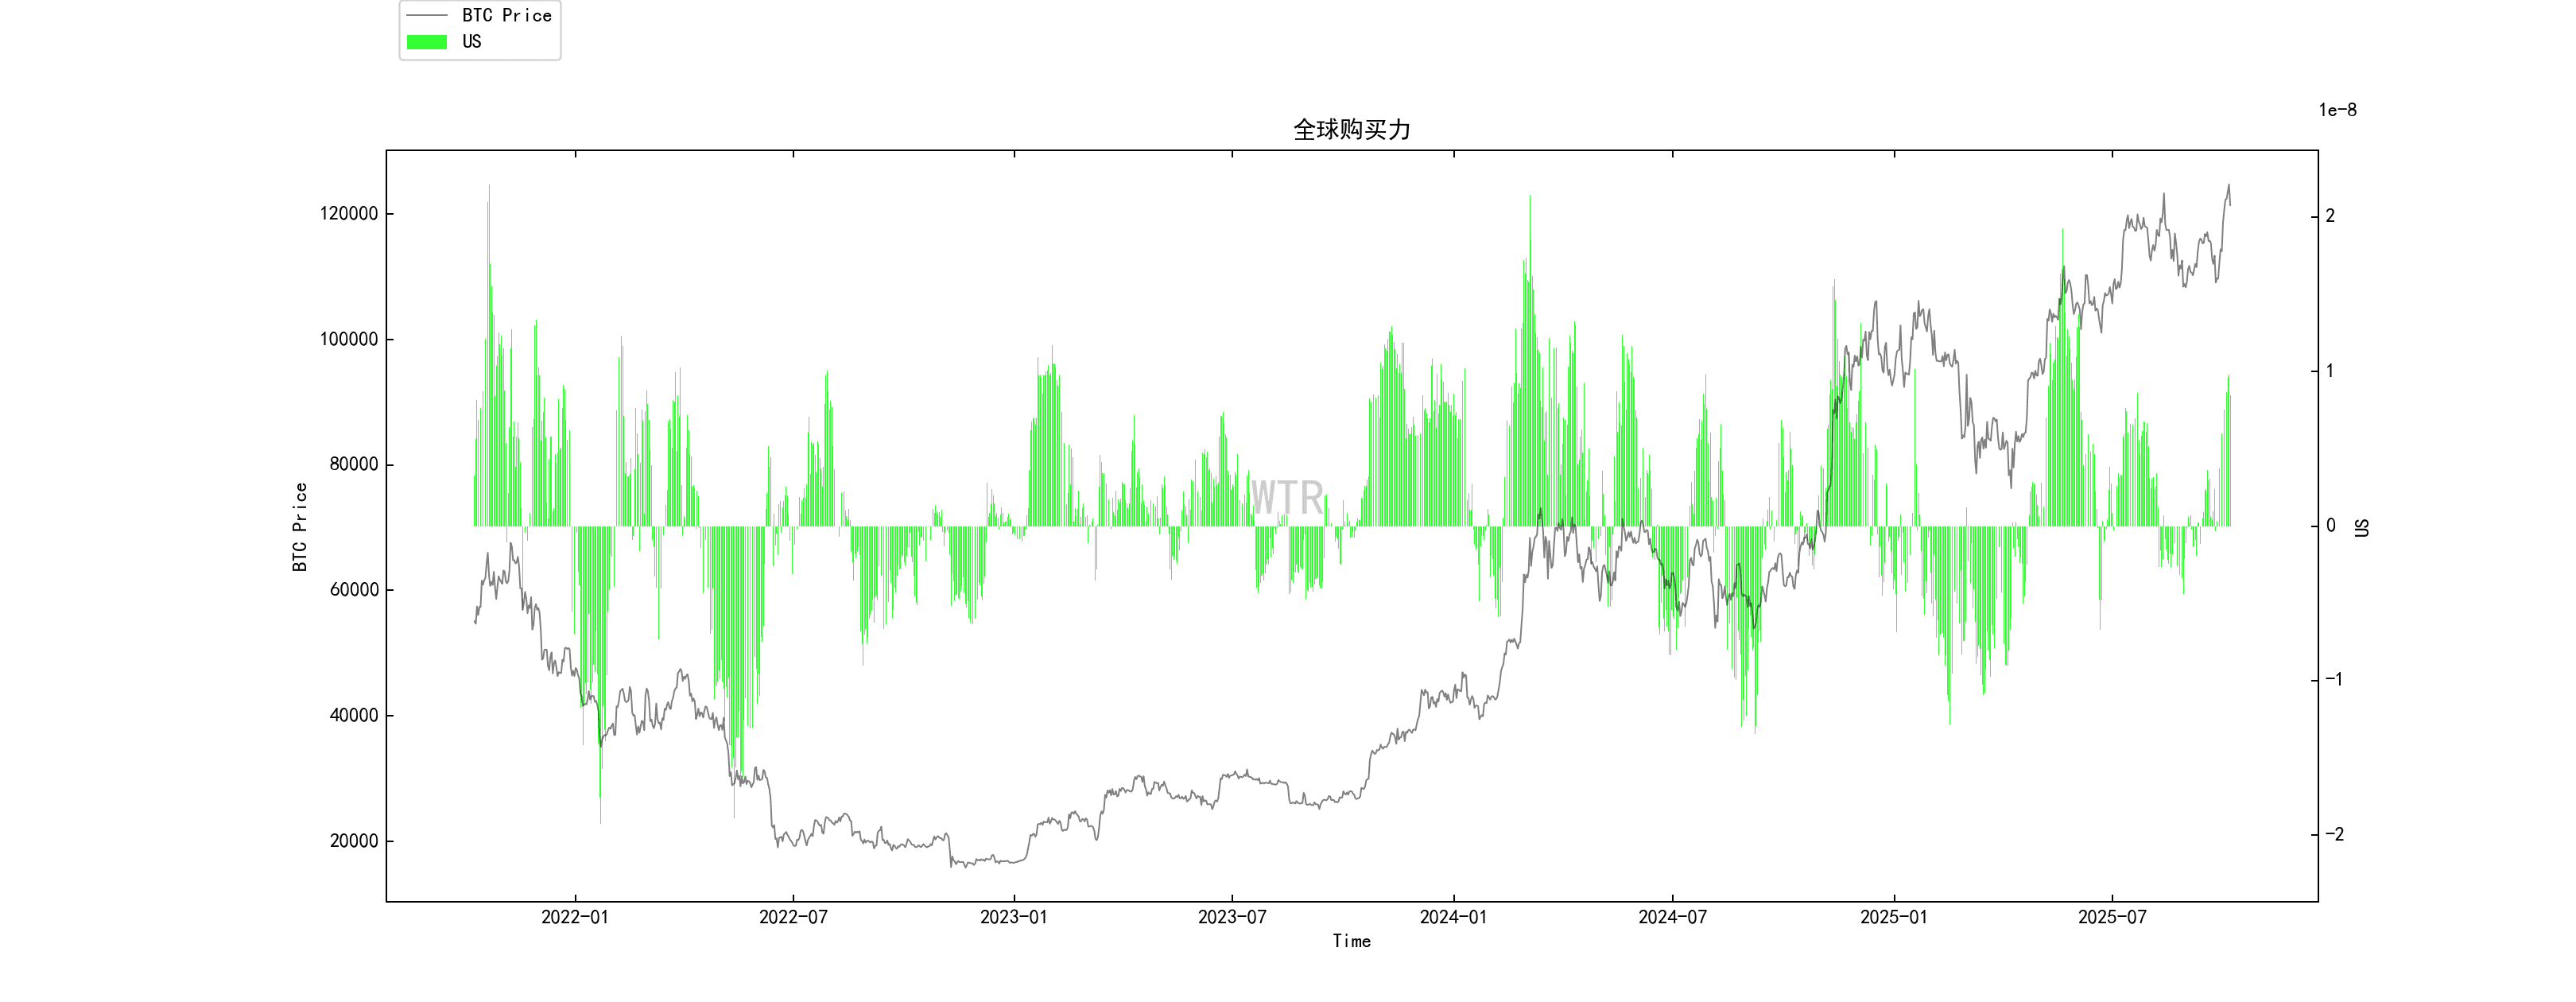
Global purchasing power has rebounded moderately.
(Figure below shows USDT exchange net positions)
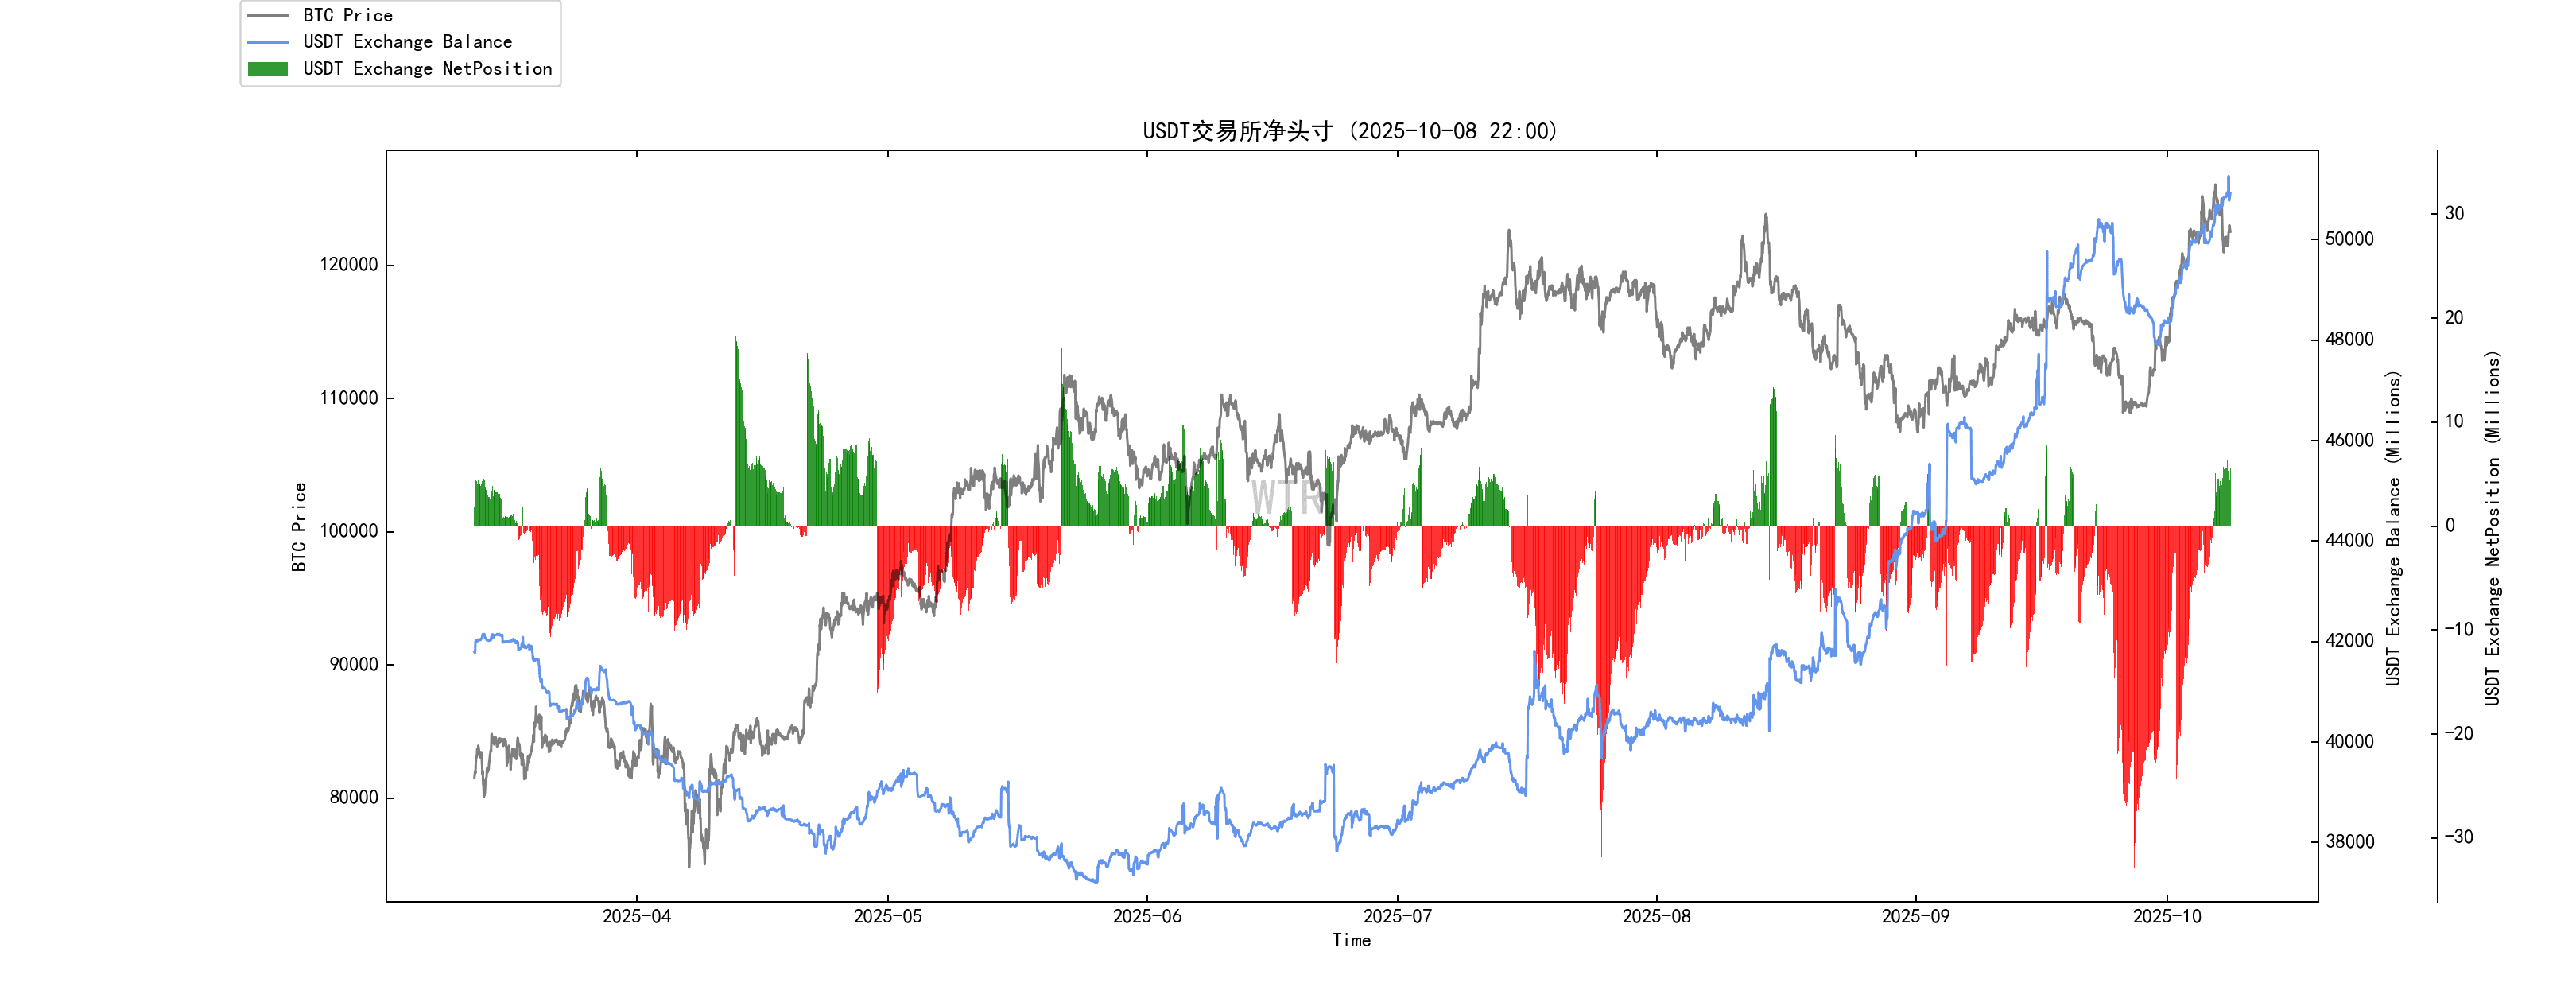
Stablecoin purchasing power remained unchanged compared to last week.
This week’s summary:

News summary:
Regulatory implementation → Capital entry: The increasingly clear global regulatory framework is paving the way for the entry of institutional funds.
From the US Stablecoin Act to the EU’s MiCA, compliant stablecoin corridors, ETF products, and real-world asset tokenization (RWA) are expanding.
This makes it possible for institutions to allocate a larger proportion of their assets under management (AUM) to the crypto sector.
These funds that "enter the market according to the system", coupled with the improvement of the market's structural risk appetite, will primarily beneficiaries of Bitcoin and Ethereum.
Mid-term main line:
Looking ahead to 2025-2026, the most certain source of beta (β) returns in the market will be the expansion of capital inflows brought about by institutional construction, namely the continued development of ETFs, compliant stablecoins and RWA tracks.
At the same time, fiscal deficits and tariff issues will cause nominal interest rates to fluctuate in a range that is difficult to go down or up, which will increase the frequency of asset rotation and provide more alpha opportunities for active traders.
Structural focus: In terms of investment structure, it is recommended to grasp the core style of Bitcoin priority, Ethereum follow-up, and altcoin differentiation.
We select leading projects from the bottom up in infrastructure, RWA and other compliance tracks with clear regulatory benefits.
Timing:
In the short term, we need to keep a close eye on two key nodes: the FOMC meeting at the end of October and the implementation of tariffs on November 1.
If the combination of "25 basis points interest rate cut + moderate policy wording + expansion of tariff exemptions" appears at that time, the fourth quarter will usher in a valuable configuration window.
Funds Verification:
Changes in the supply of stablecoins and net subscription data of ETFs are the purest indicators for observing the true liquidity of the market.
The current strong momentum of a net increase of $5.55 billion in stablecoins in 7 days and the cumulative size of Bitcoin ETFs exceeding $50 billion both eloquently prove that compliant long-term funds have been deeply involved in the market.
However, it should be recognized that the style of these funds still tends to be high-quality and highly liquid assets, and has not yet fully spread to high-risk areas.
On-chain long-term insights:
There is buying below and a top above: the follow-up at 109–116k is real and repeated; the selling pressure and entry behavior at 125–129k are still there.
The threshold is stable and the trend continues: the STH cost line rises and is above the line, and the trend is not bad;
Incremental funds determine the breakthrough situation: the heartbeat of the ETF and the rate of change of illiquid whales will determine whether it will break through the upper limit or fall back and absorb;
The macro economy is the underlying trend: if a window of weakening dollar due to interest rate cuts appears, breakthroughs will be smooth in the future; if tariffs and re-inflation dominate, time will be exchanged for space.
Market setting the tone:
The volatility is relatively strong.
Strategically, we should observe the effectiveness of buying during pullbacks and pay attention to the cooperation of incremental funds during upticks.
There is a time when we first need to respect the support role of the $114,000-116,000 range, and then see if the market has enough incremental impulses to challenge the pressure of $125,000-129,000.
On-chain mid-term exploration:
The liquidity supply is growing slowly but steadily, and the pace of the market is neither fast nor slow.
The massive outflow from exchanges has slowed down, and the market has gradually become rational and returned to a neutral rhythm.
The supply of stablecoins maintains a slow annual increase, and moderate growth is the source of market momentum.
USDC users have a neutral attitude, and the only concern for on-site purchasing power is sustainability.
The whales choose to sell after the rise, are anxious about taking profits, and rely on off-market funds.
Market setting the tone:
Mild, neutral
The market is in a moderate, neutral state with a moderate offensive rhythm. There are capital stagnation or profit taking on the way forward.
At present, we need to pay more attention to the price level that the market funds can support.
Market setting the tone:
On-chain short-term observation:
Derivatives rating: The risk factor is in the neutral area and the derivatives risk is moderate.
The number of newly added active addresses is relatively low.
Market sentiment status rating: Optimistic.
The overall net positions of exchanges show moderate outflows of both BTC and ETH.
Global purchasing power has rebounded moderately, and the purchasing power of stablecoins has remained the same compared to last week.
The probability of not falling below 110,000-105,000 in the short term is 70%;
Market setting the tone:
Market sentiment shifted from neutral to optimistic.
In the short term, it is expected that the market will not experience significant fluctuations this week, at least it will not touch the cost line of short-term holders again. Perhaps market participants are waiting for the FOMC at the end of October.
The short-term market tone-setting part has been continuously reminding people from the weekly report on August 25 to last week that the price has reached the "second buying point" opportunity of the short-term holders' cost line. So far, the market has realized the increase of this opportunity.
Risk Warning:
The above are all market discussions and explorations and do not provide any directional opinions on investment; please view and prevent market black swan risks with caution.
This report is provided by the "WTR" Research Institute.
Follow us!

