
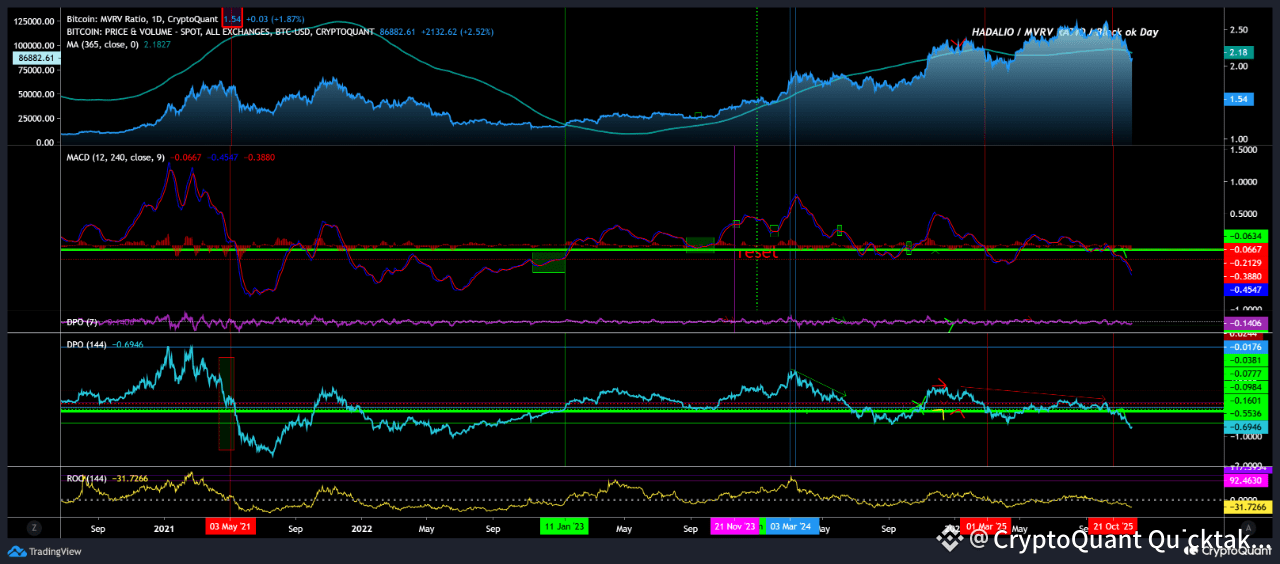
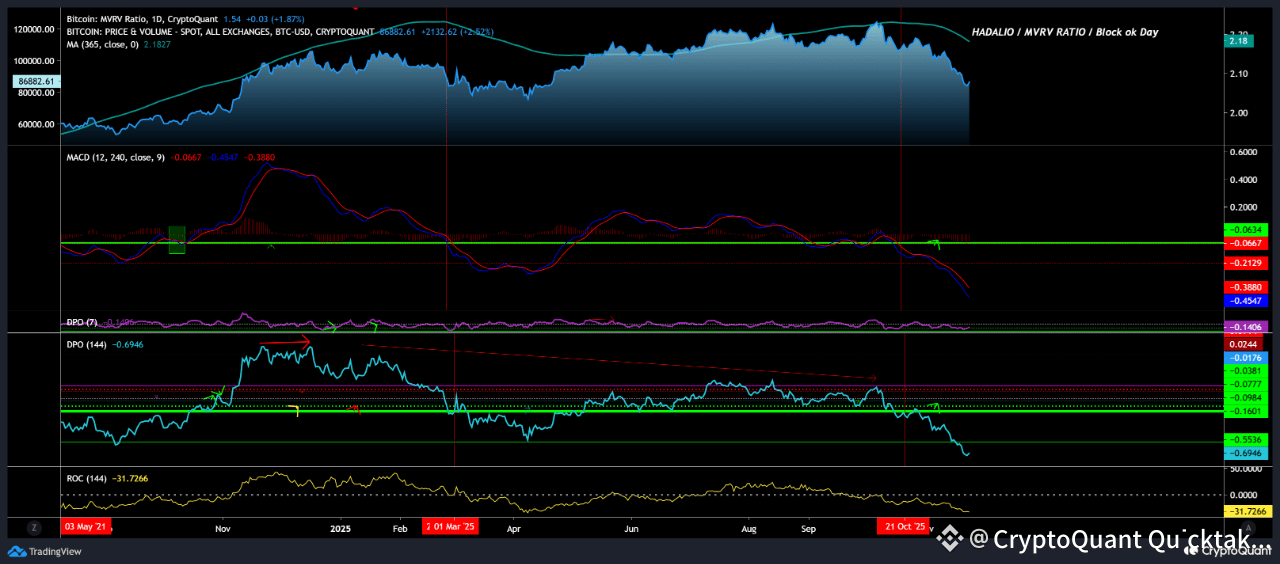
The MACD chart of the MVRV ratio, using parameters 12 and 240 (which I created personally), can distinguish between downtrends and uptrends.
When the horizontal green line on the MACD chart breaks upward, it signals the revival of an uptrend. On the other hand, when the horizontal green line breaks downward, it indicates the start of a downtrend.
We have clearly entered a downtrend at this time, and for an uptrend to return, the green horizontal line must break upward.
Despite Bitcoin's current price, the past vertical red line in the MVRV ratio shows that we are in a downtrend.
We have now formed a downtrend, and it appears that some time will be needed before an uptrend arrives.
Written by HaDaliO_iHDWu
