After DOGE/USD falls below the $0.150 area, it begins a new round of decline. Currently, DOGE is consolidating its losses and may face resistance around $0.1420.
DOGE price drops below $0.150, starting a new round of decline.
Current price is below the $0.1450 level and the 100-hour simple moving average.
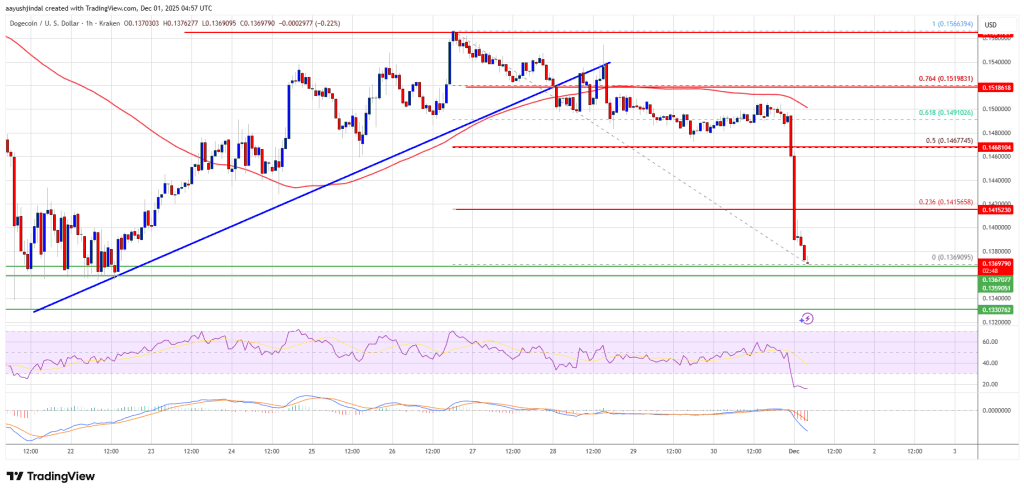
DOGE/USD hourly chart has broken below a key ascending trend line, with support at $0.1520 (data source: Kraken).
If the price remains below $0.150 and $0.1450, the downtrend may intensify.
DOGE price declines again.
After the price of Dogecoin closed below $0.1520, a new round of decline began, similar to the movements of Bitcoin and Ethereum. Dogecoin broke below the support levels of $0.150 and $0.1450.
More importantly, on the DOGE/USD hourly chart, the price has broken below a key ascending trend line that provided support around $0.1520. The price even briefly fell below $0.1380. The low was close to $0.1369, and the current price has fallen below the 23.6% Fibonacci retracement level of the drop from the high of $0.1566 to the low of $0.1369, indicating a bearish signal.
The price of Dogecoin is currently below $0.1450 and also below the 100-hour simple moving average. If a rebound occurs, the immediate resistance level above is around $0.1420. The first major resistance level for bulls may be around $0.1465, as well as the 50% Fibonacci retracement level of the drop from $0.1566 to $0.1369.
 The next major resistance level is around $0.1490. If the closing price is above the $0.1490 resistance level, the price may further rise to the $0.1520 resistance level. If the price continues to rise, it may further test $0.1550. The next major stop-loss level for bulls could be $0.1620.
Will the decline of Dogecoin continue?
If the price of Dogecoin (DOGE) fails to break above $0.1465, it may continue to decline. The initial support level is around $0.1370. The next major support level is around $0.1350.
The main support level is at $0.1330. If the price falls below the $0.1330 support level, it may decline further. In this case, the price may briefly test $0.1250 or even $0.1240.
Technical Indicators
Hourly MACD Indicator – The MACD for DOGE/USD is currently accelerating weaker within the bearish zone.
 Hourly Relative Strength Index (RSI) – The RSI for DOGE/USD is currently below the 50 level.
Main support levels – $0.1350 and $0.1250.
Major resistance levels – $0.1420 and $0.1465.


