


The price of Bitcoin is trading around $89,000 on Monday after failing to break above the descending trend line last week.
The price of Ethereum is heading towards a major support level at $3,017 after repeatedly failing to close above the 50-day exponential moving average at $3,280.
The price of XRP is approaching a major support level at $1.96, where a steady close below indicates an additional correction coming.
Bitcoin ($BTC ) and Ethereum ($ETH ) and Ripple ($XRP ) are trading around key levels on Monday after a slight correction in the previous week. The three largest cryptocurrencies by market capitalization may face increasing bearish risks as bearish momentum increases across key indicators. Market participants are closely monitoring critical support areas for signs of stability or deeper corrective movement.
Bitcoin failed to close above the descending trendline.
The price of Bitcoin was rejected from the descending trendline (drawn by connecting several peaks since early October) last week. This line coincides with the 61.8% Fibonacci retracement level at $94253 (drawn from the April low of $74508 to the all-time high of $126199 set in October), making it a major resistance area. As of Monday, BTC is trading around $89000.
If BTC continues its decline, the drop may extend toward the next key support at $85569, which aligns with a 78.6% Fibonacci retracement level.
The Relative Strength Index (RSI) on the daily chart is at 43, below its neutral level of 50, indicating that the bearish momentum is gaining strength. Furthermore, the Moving Average Convergence Divergence (MACD) lines are converging, and a shift to a bearish crossover would further support the bearish outlook.
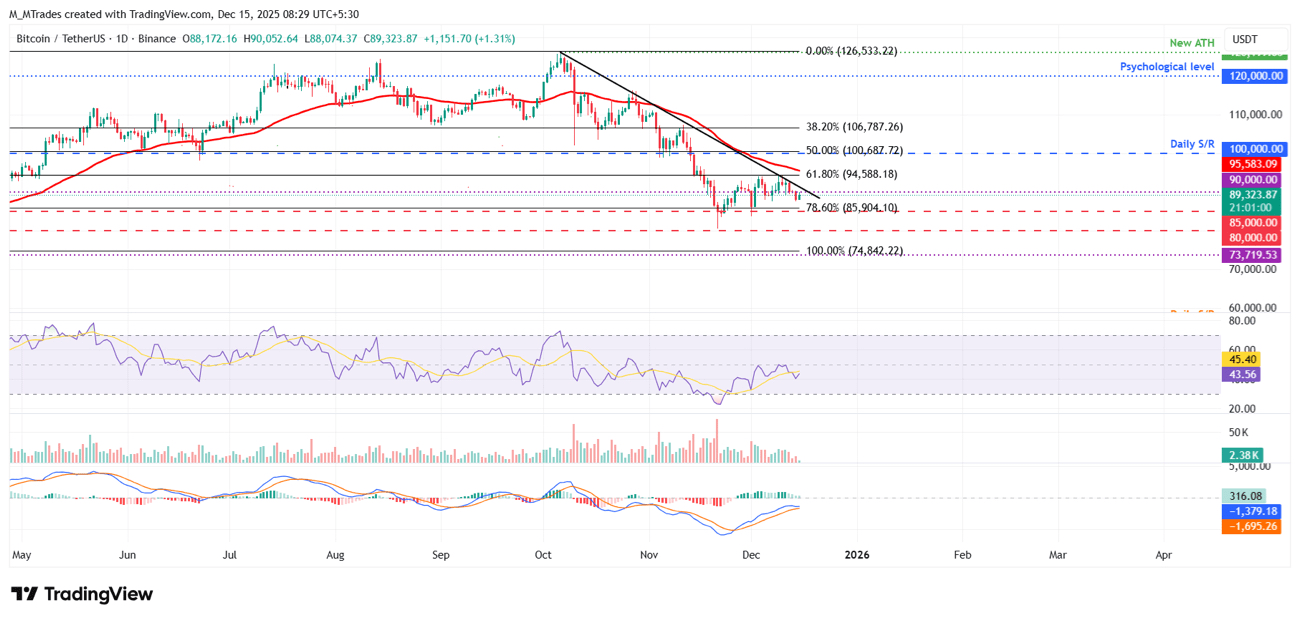
The daily chart for the BTC/USDT pair
Looking upward, if BTC breaks above the descending trendline and closes above the resistance level of $94253, the rise may extend toward the psychological level of $100000.
Ethereum is correcting after facing rejection from the 50-day exponential moving average.
The price of Ethereum failed to close above the 50-day exponential moving average at $3280 on Wednesday and has dropped by 7.62% by Sunday. As of this report on Monday, ETH is trading around $3100.
If ETH continues to correct and closes below the daily support at $3017, the decline may extend toward the next support at $2749.
The Relative Strength Index on the daily chart is at 49, slipping below the neutral level of 50, indicating early signs of bearish momentum. Similarly, the MACD lines are converging, and a confirmed bearish crossover would indicate a more negative outlook.
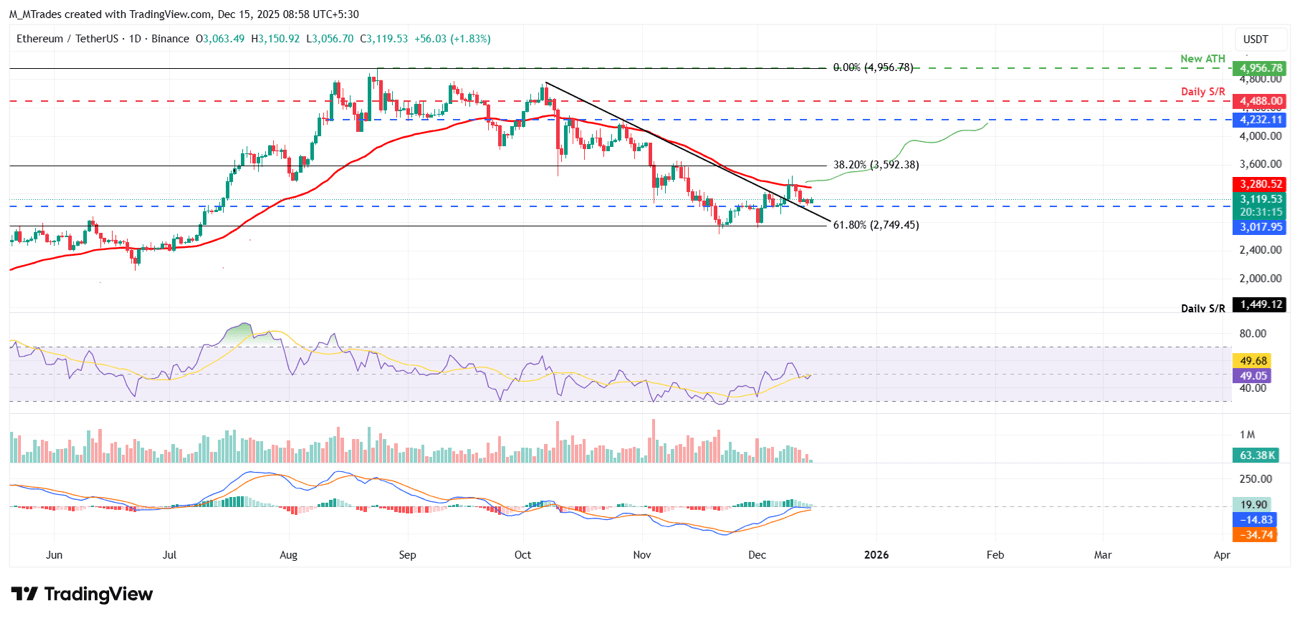
The daily chart for the ETH/USDT pair
On the other hand, if ETH recovers, the recovery may extend toward the 50-day exponential moving average at $3280.
XRP may extend its decline if it closes below the support of $1.96.
The price of XRP has decreased for the second consecutive week by 3.22%, with a retest of the key daily support at $1.96 on Sunday. As of this report on Monday, XRP is trading around $1.99.
If XRP closes below the daily support at $1.96, the decline may extend toward the next daily support at $1.77.
The Relative Strength Index on the daily chart is at 40, below its neutral level of 50, indicating that the bearish momentum is gaining strength. Additionally, the MACD lines are converging, suggesting uncertainty among traders.
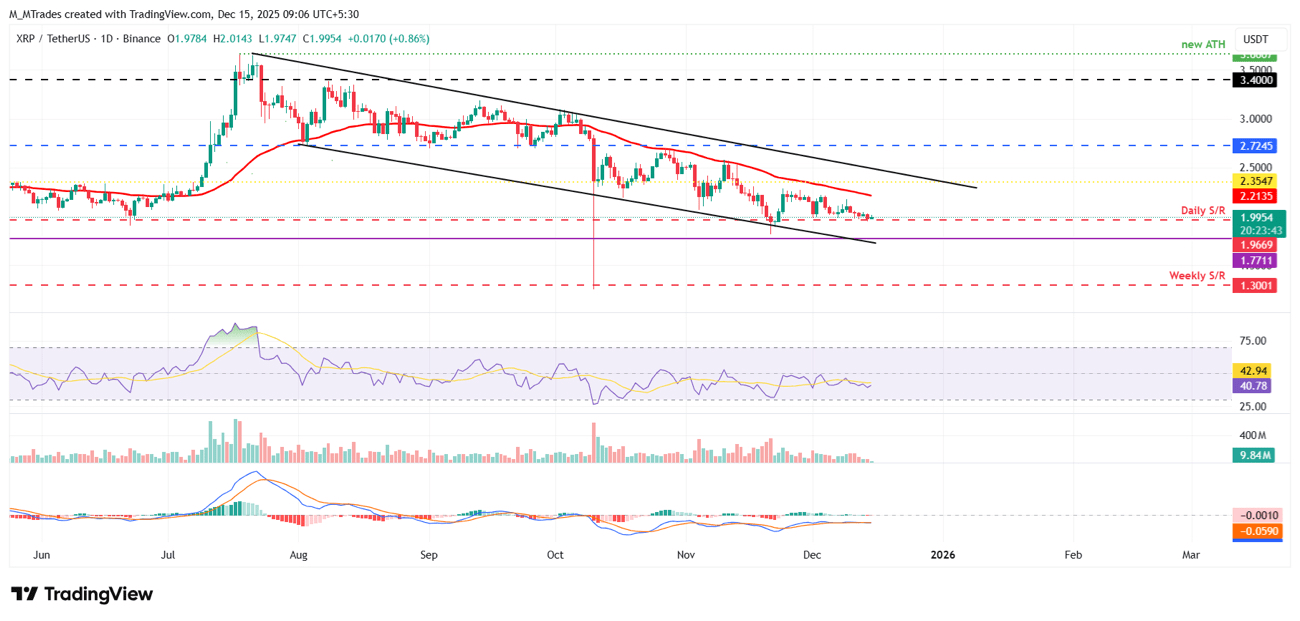
The daily chart for the XRP/USDT pair
However, if the daily support holds at $1.96, the rise may extend toward the next daily resistance at $2.35.
