
The current LUNC spot market shows an extreme one-sided upward trend, with prices soaring 70.3% in 24 hours, significantly breaking through medium to long-term moving averages and holding costs, and touching the upper Bollinger Band. Market sentiment is extremely greedy. However, the futures market shows a significant divergence, with the funding rate remaining negative and open interest reaching $41,240,000, indicating a crowded leveraged short position and strong long-short game and liquidation risks in the market.
Key prices and range structure
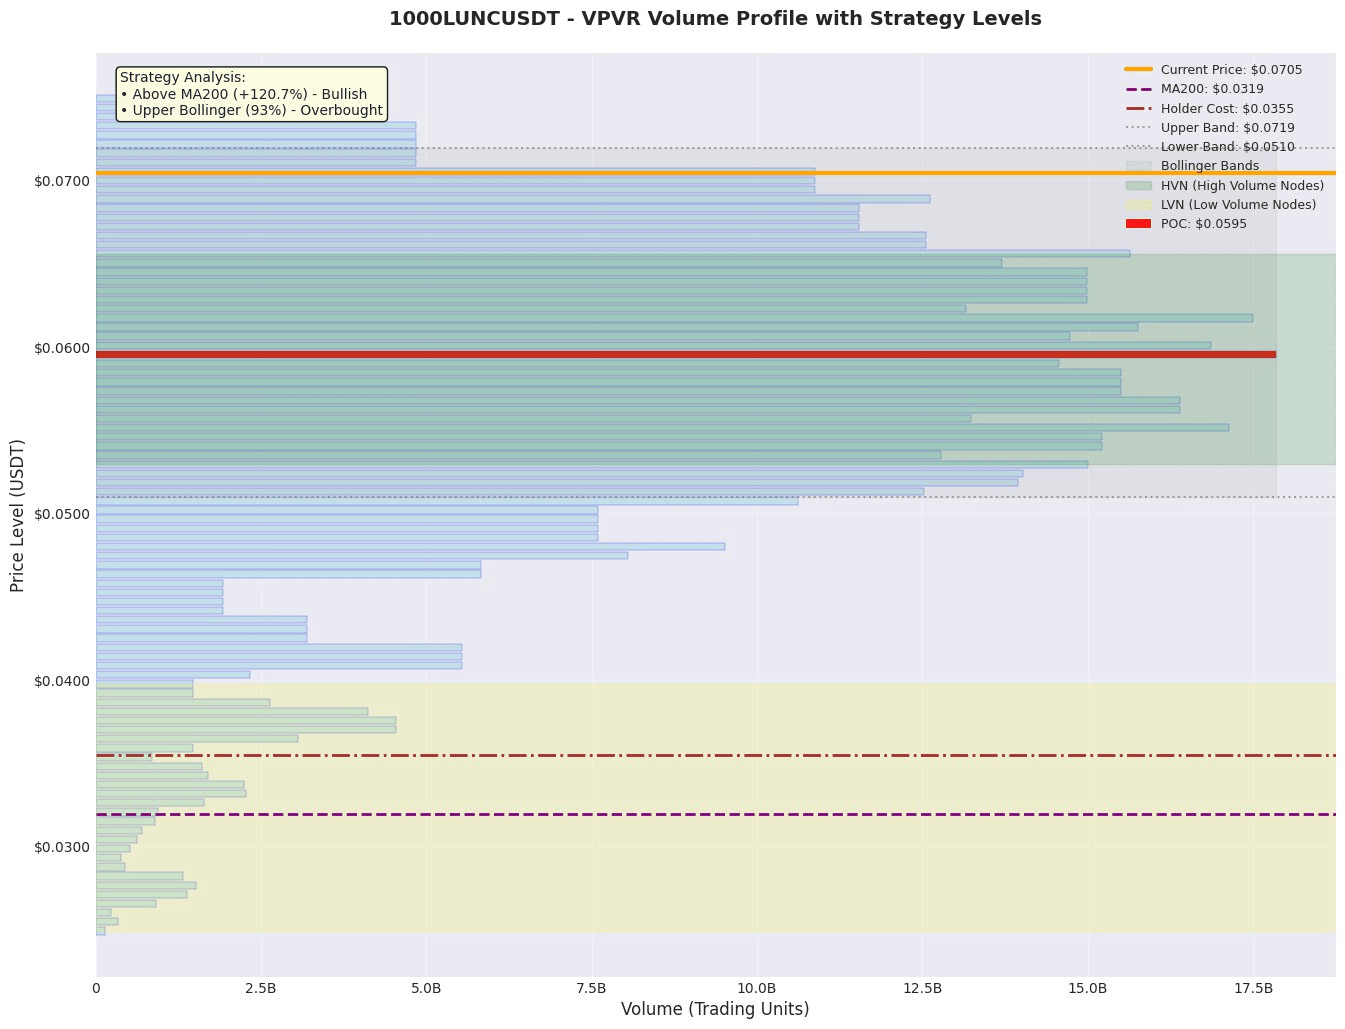
1. Value anchoring area: According to VPVR data, the current POC (point of control) is at 0.0595, and the value area ranges from 0.0513 to 0.0694. This means that most of the chips have been exchanged within this range recently, with the VAH of 0.0694 being the upper boundary of the nearest value area below the current price, forming a key short-term support. The current price of 0.07047 has broken through this area, and it needs to be observed whether it can hold steady.
2. Trends and Volatility Range: The price of 0.07047 is far above MA200 (0.0319, deviating by 120.7%) and the cost of holding (0.0355, deviating by 98.7%), indicating an extremely strong medium to long-term trend. The upper Bollinger Band is at 0.07193, and the current price is at the 93% percentile of the Bollinger Band, having entered the overbought area, facing resistance at the upper band in the short term.
3. High Volume / High Concentration Area (HVN): The 0.0595 area where POC is located is a typical high-volume area and provides strong support during price pullbacks. The value area from 0.0513 to 0.0694 forms a broad HVN buffer zone, where prices may oscillate repeatedly.
Derivatives and Liquidity Analysis
• Leverage Bias and Crowding: The funding rate is negative (-0.00061516), indicating that short position holders in the perpetual contract market must pay fees to long position holders, leading to significant crowding in short positions. The long-short ratio increased slightly from 0.8384 to 0.8503, still favoring longs, but considering the negative funding rate, there are many 'bearish but not shorting' or hedging positions.
• Liquidity Signals: Contract trading volume surged by 308%, but the absolute value of open interest (OI) reached as high as $41.24 million, showing that a large amount of new capital (especially shorts) is flooding into the market. Market liquidity has not dried up, but volatility has sharply increased. OI and prices rising significantly often indicate that trends may continue, but this also accumulates significant liquidation risks.
• Leverage and Position Suggestions: The current market is in an extreme environment of high volatility and high leverage. A negative funding rate is a dangerous contrary signal, indicating that shorts are unwilling to give up, which could lead to a severe 'short squeeze' market. Therefore, it is absolutely unsuitable to amplify leverage; any trades should reduce positions, primarily focusing on observation or very small position trial trades.
News and Event Impact
Currently, there are no major news events. The sharp fluctuations in price mainly stem from internal technical breakthroughs in the market and derivative gaming.
Trading Strategy
Plan A: Aggressive Breakthrough Long (High Risk)
• Direction: Light position trial long
• Logic: Price strongly breaks through the upper edge of the value area (VAH: 0.0694). If it stabilizes, it may launch an upward attack.
• Entry Range: When the price pulls back and stabilizes in the 0.0694-0.0700 area.
• Stop Loss: 0.0680 (below the previous VAH support).
• Target: Upper Bollinger Band 0.07193, as well as the liquidity gap above (data missing, can observe the order book).
• Expected Risk-Reward Ratio: Based on entry at 0.0697, stop loss at 0.0680, and target at 0.0719, the risk-reward ratio is approximately (0.0719-0.0697) / (0.0697-0.0680) ≈ 1.29.
Plan B: Conservative Pullback Buy (Wait for Confirmation)
• Direction: Wait and see, waiting for pullback buying opportunities.
• Logic: The price is severely overbought and far from the value center. The negative funding rate indicates pullback risks. Wait for the price to return to the core value area for support.
• Entry Range: When the price deeply pulls back to the strong support area of POC and HVN at 0.0595-0.0610 and shows a stop-loss signal.
• Stop Loss: 0.0580 (below the critical POC level).
• Target: To retest the previous high around 0.071.
• Expected Risk-Reward Ratio: Based on entry at 0.0600, stop loss at 0.0580, and target at 0.0710, the risk-reward ratio is approximately (0.0710-0.0600) / (0.0600-0.0580) = 5.5.
Risk Alerts and Position Management
1. Main Risks:
• Short Squeeze and Reversal Risk: In a negative funding rate environment, if prices continue to rise, it may trigger a chain liquidation of shorts (short squeeze), but once the upward momentum weakens, concentrated short liquidations may also lead to a price flash crash.
• Technical Overbought Pullback: Prices are at the upper Bollinger Band (93% percentile), and momentum indicators like RSI (data missing) may have been extremely overbought, indicating a significant technical pullback demand to MA200 or the value area.
• Liquidity Sudden Change Risk: After a 308% surge in contract trading volume, if subsequent volumes cannot be maintained, there may be liquidity gaps that exacerbate price fluctuations.
2. Position and Risk Control Recommendations:
• Absolute prohibition of high leverage: The current environment is highly volatile, and high leverage is easily washed out.
• Use very small positions for testing: Total position is recommended not to exceed 5% of the principal, using a phased layout strategy, only entering light positions after stabilization at key support levels (such as POC).
• Actively avoid extreme periods: If the funding rate turns positive and price stagnates, or if contract trading volume plummets, it should be regarded as a danger signal, and positions should be closed immediately for observation.
Like and follow for real-time updates!
$1000LUNC
