
The current ADA spot and contract market is showing a weak oscillation pattern. Prices are operating below the MA200 and the cost line, and are located in the lower half of the Bollinger Bands, indicating an overall weak trend. However, trading volume has significantly increased and the buy-sell pressure ratio shows more aggressive buying. Combined with the very small spread between spot and contract prices, there has not been a panic sell-off in the market; rather, it is in a phase of long-short game, searching for direction.
Key prices and range structure
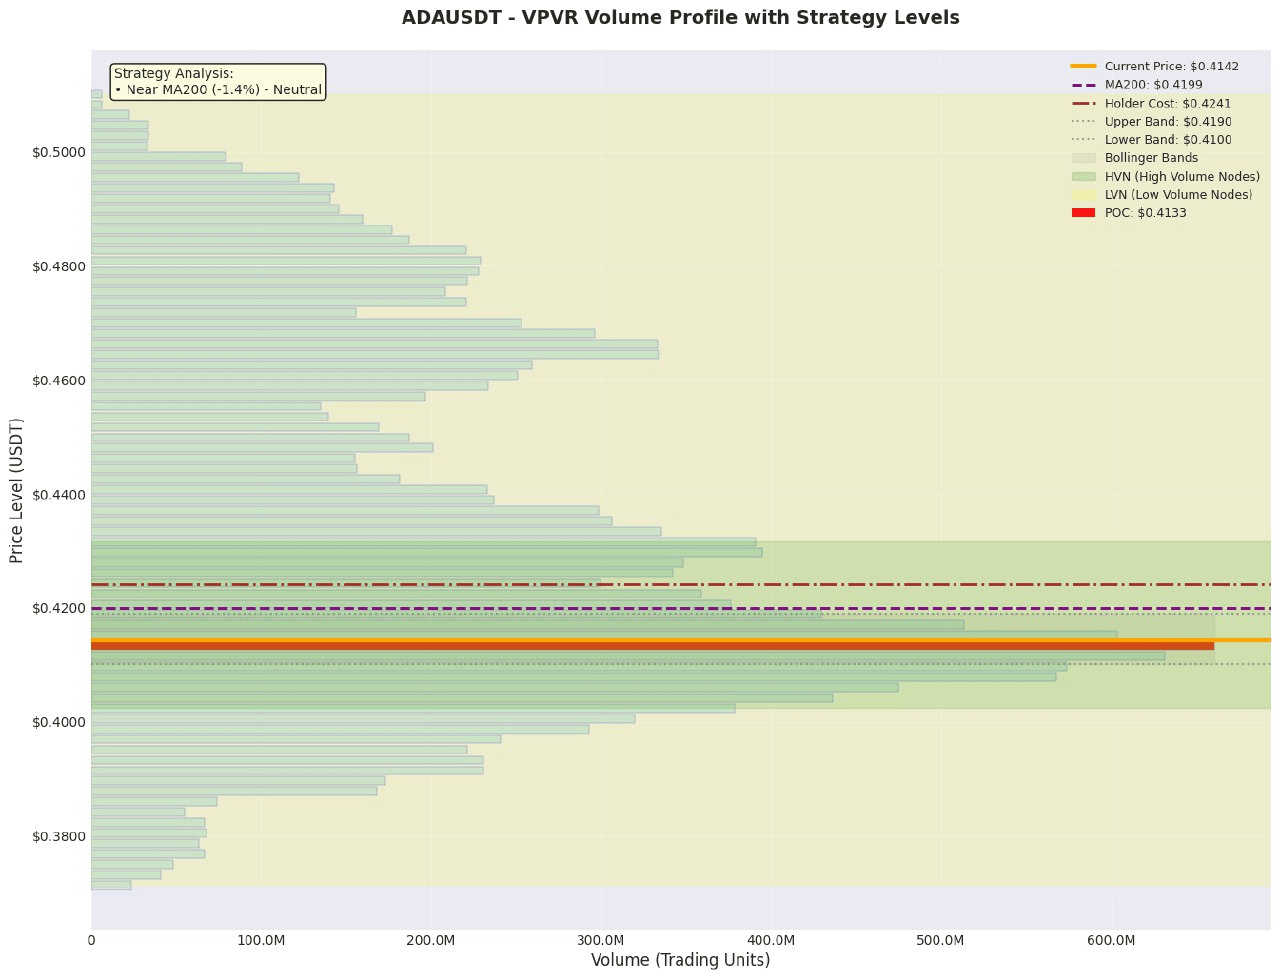
1. Value anchoring area: According to VPVR data, POC (point of control) is at 0.413336, almost coinciding with the current price of 0.4142, indicating that this price level is the core area of the recent long-short game. The Value Area (VA) range is from 0.391 to 0.481, and the current price is located in the upper half of the VA, close to the upper edge. POC is a key short-term support; if it breaks down, it may accelerate towards the lower edge of the VA; if it can stabilize, it may test the VAH (0.481).
2. Trend and volatility range: The current price 0.4142 is about 1.4% below the MA200 (0.4199), indicating that the medium to long-term trend remains weak. The Bollinger Band range has narrowed (0.410 - 0.419), with prices located in the lower part (46.4%), indicating reduced volatility, and prices are oscillating within a narrow channel, facing a directional choice. The lower Bollinger Band at 0.410 is an important short-term support.
3. High trading volume/concentrated positions (HVN): POC (0.4133) itself forms a significant HVN, making it easy for prices to fluctuate here. Additionally, the market data shows a large accumulation of sell orders near 0.9 and 0.8, forming a strong resistance area; while below, there are a large number of buy orders near 0.3 and 0.35, forming long-distance support.
Derivatives and liquidity analysis
• Leverage fund sentiment: The funding rate is only 0.00003688 (about 0.0037%), almost zero, indicating that the sentiment in the perpetual contract market is extremely balanced, with no significant one-sided bets. The long-short ratio has dropped from 1.56 to 1.30, indicating that long positions have been reduced, but have not entered an extremely bearish range.
• Liquidity situation: Contract trading volume plummeted -37.0%, which is a significant signal of liquidity exhaustion, usually indicating that a change in trend is imminent. Open interest (OI) remains at 110 million dollars, not following the trading volume in a sharp decline, indicating that existing positions have not exited on a large scale, and the market is waiting for new catalysts.
• Leverage and position suggestions: In the current market with shrinking trading volume and unclear direction, high leverage should be avoided. The low activity of leverage funds means that the market lacks sustained momentum, amplifying leverage risk is extremely high, making it more suitable for light positions or waiting for confirmation of direction as trading volume increases.
Trading strategy
Plan one: Conservative bottom-fishing plan (going long)
• Logic: The price is supported near the POC and the lower Bollinger Band, and the buying pressure is stronger than selling pressure, attempting to capture a short-term rebound.
• Entry range: 0.4100 - 0.4135 (from the lower Bollinger Band to POC support area)
• Stop loss: 0.4050 (breaking below the recent oscillation low)
• Target: 0.4190 (near the upper Bollinger Band/MA200), 0.4240 (cost line)
• Expected profit-loss ratio: ( (0.4190 - 0.4118) / (0.4118 - 0.4050) ) ≈ 1.06 : 1 (calculated based on the entry midpoint 0.4118)
Plan two: Aggressive breakout plan (short selling)
• Logic: If the price cannot effectively stay above MA200 and the cost line, and it breaks below the POC and the lower Bollinger Band with increased volume, the weakness continues.
• Entry signal: Price breaks below 0.4100 (lower Bollinger Band) and is accompanied by increased trading volume.
• Stop loss: 0.4150 (returning above POC)
• Target: 0.4000 (psychological level), 0.391 (VA lower edge)
• Expected profit-loss ratio: ( (0.4100 - 0.4000) / (0.4150 - 0.4100) ) = 2.0 : 1 (calculated based on breakout entry price 0.4100)
Risk warning and position management
1. Main risks:
• Liquidity risk: Contract trading volume plummeted -37.0%, insufficient market depth, large orders may trigger significant price fluctuations, and stop loss orders are easily triggered.
• Trend risk: The price continues to operate below MA200 and the cost line, the overall trend has not reversed, and any rebound may face bearish pressure.
• Market structure risk: The buying and selling difference at close range (0.5%) is negative (more sell orders), indicating that short-term selling pressure still exists, which may hinder immediate rebounds.
2. Position and risk control suggestions:
• Given the shrinking trading volume and unclear direction, it is not suitable to go all in at once. If executing a strategy, it is recommended to use staggered, small position trial orders.
• It is recommended that single trade risk be controlled within 1% of total account funds, and strictly avoid using high leverage (recommended leverage ≤ 5x).
• If the market shows continued shrinking contract trading volume or prices remain stagnant at key points (such as 0.410) for an extended period, proactively reduce positions or pause new positions, waiting for volume signals.
Like and follow for real-time updates!
$ADA
