Currently, the spot and contract prices of BTC are basically flat, and the market is in a narrow fluctuation state. Prices are running below the key moving average MA200 and the cost of holding positions, indicating that short-term momentum is weak, but the Bollinger Bands are still in the upper half, and have not yet entered an extremely weak zone. Market sentiment is cautious, and there has been no extreme environment of unilateral panic or greed.
Key price and range structure
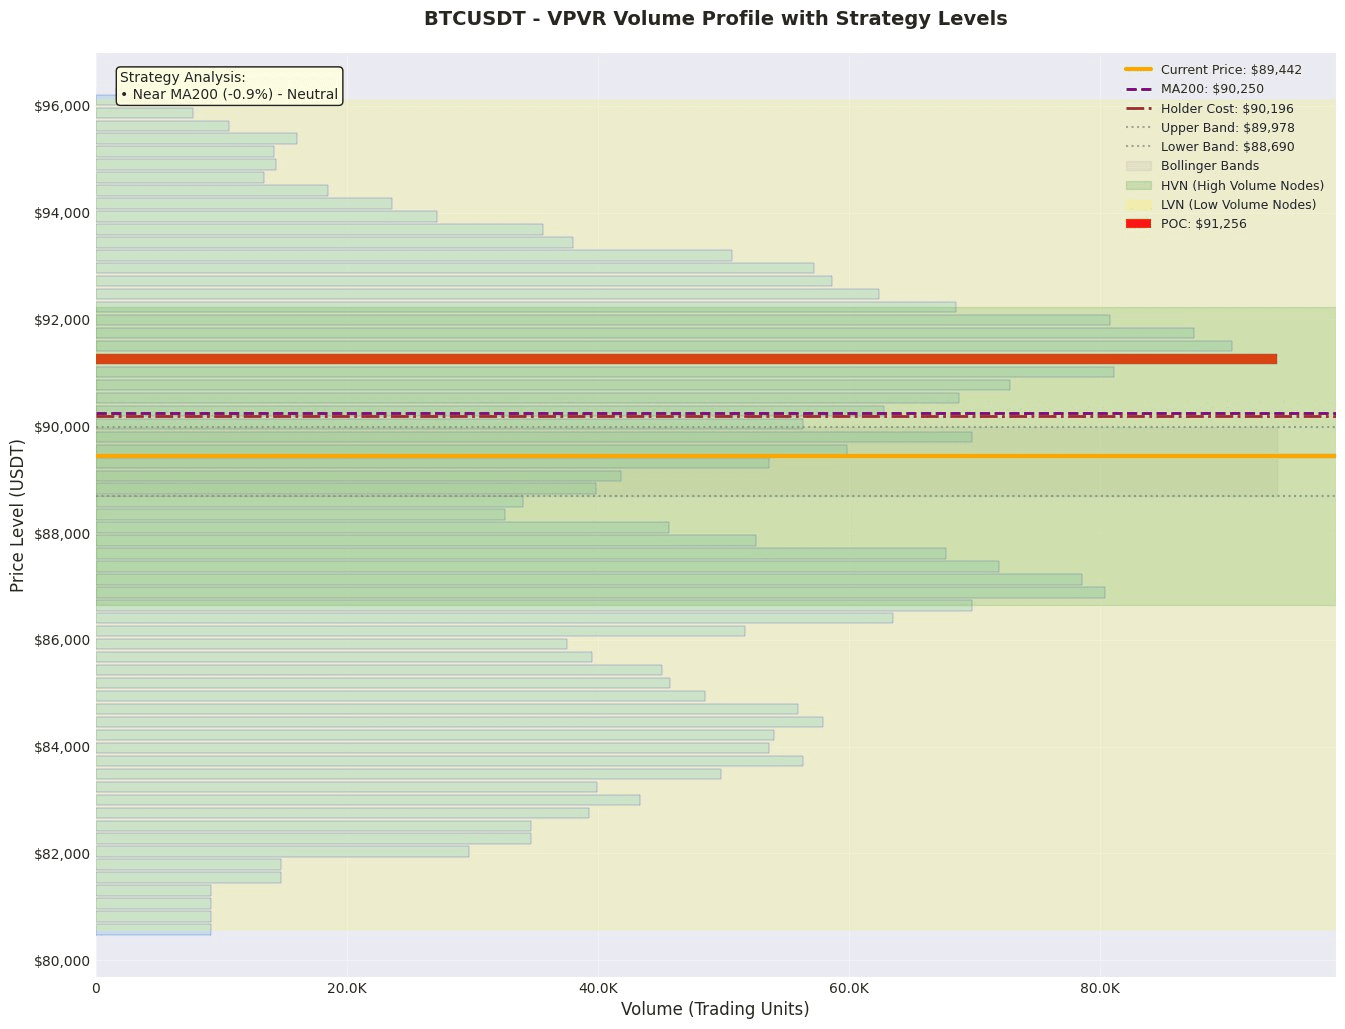
1. Value anchoring area: According to VPVR, POC (Point of Control, maximum transaction volume price) is at 91256, which is the core area of the recent long-short game and constitutes strong resistance above. The Value Area is from 83488 to 93198, and the current price of 89441 is in the lower part of this range, indicating that the overall market valuation center is relatively high, but short-term prices are weak. If the price cannot return above the POC, it may test the lower edge of the value area, VAL (83488), for support.
2. Trend and volatility range: The current price of 89441 is approximately 0.9% below MA200 (90250), which is an important medium to long-term trend signal, indicating that the upward trend may face challenges. The Bollinger Band range is from 88690 to 89978, with the price above the middle band, indicating a short-term volatility bias towards strength at 58.4%. However, the upper band (89978) and MA200 (90250) together form a dense pressure zone. The lower Bollinger Band (88690) is a key short-term support.
3. High trading volume/Concentration area (HVN): VPVR data shows that POC (91256) is a significant high trading volume area, representing strong resistance. Additionally, the order book shows main sell units at 90000 and 89812, coinciding with the MA200 and Bollinger Band upper limit area, further confirming the strong pressure in the 90000-90250 range. Main buy units are at 88000 and 88200, forming initial support below.
Derivatives and liquidity analysis
The current contract trading volume has surged by 139.7%, while the open interest (OI) has reached 7949.16M. The OI/market cap ratio is at a very high level, indicating active and crowded leveraged funds. The funding rate is close to zero, and the long-short ratio has slightly decreased to 2.1980, showing a cooling in bullish sentiment, but overall still leans towards bullish. Analysis conclusion: The market's leverage level is extremely high, and there has been no extreme positive premium in the funding rate, with a slight easing in the degree of bullish crowding. The increase in trading volume accompanied by a price drop may indicate that some funds are actively exiting or short positions are being opened. In such a high-leverage, high OI environment, any price fluctuation may be amplified, making it highly unsuitable to increase leverage; trading should primarily focus on low leverage or spot trading, with strict risk control measures in place.
News and event impact
Currently, there are no major news events, and the market is mainly driven by technical factors and derivative capital games.
Trading strategy
Plan One (Conservative/Bearish Rebound Failure Plan):
• Direction: Short
• Entry range: 89800 - 90150 (This range combines the main sell unit 89812, Bollinger Band upper limit 89978, and MA200 90250 pressure)
• Stop loss level: 90500 (Placed below MA200 and POC 91256, providing a buffer above the pressure zone)
• Target level: First target 88690 (Bollinger Band lower limit), second target 88000 (main buy unit)
• Expected risk-reward ratio: Based on entry at 90150, stop loss at 90500, target at 88690, risk of 350 points, reward of 1460 points, risk-reward ratio approximately 1:4.17.
Plan Two (Aggressive/Bullish Support Rebound Plan):
• Direction: Long
• Entry range: 88600 - 88800 (This range is close to the Bollinger Band lower limit 88690, which is a key short-term support)
• Stop loss level: 88300 (Placed above the main buy unit 88000 to prevent false breakouts)
• Target level: First target 89800 (main sell unit), second target 90250 (MA200)
• Expected risk-reward ratio: Based on entry at 88800, stop loss at 88300, target at 89800, risk of 500 points, reward of 1000 points, risk-reward ratio approximately 1:2.
Risk warnings and position management
1. High leverage risk: The OI/market cap ratio is extremely high, and the overall leverage in the market is at a dangerous level. A one-sided market movement can easily trigger a series of liquidations, exacerbating volatility.
2. Liquidity risk: The contract trading volume has skyrocketed while the price has fallen, caution is needed to determine if this is the starting signal for a 'volume drop.' If subsequent trading volume plunges while prices continue to decline, liquidity exhaustion risk should be guarded against.
3. Sentiment shift risk: Although the long-short ratio has decreased, it remains at a high level. If the price continues to fail to recover MA200, it may trigger a long squeeze.
Position management suggestions:
• Given the high leverage environment, high leverage should be avoided. It is recommended that the total position risk exposure does not exceed 5% of the principal.
• Use a staggered entry strategy, especially when testing key support/resistance levels, establishing an observation position first, and considering adding to the position after confirming effectiveness.
• If there is a sharp decline in contract trading volume (e.g., falling below the 24h average) or if the funding rate turns significantly negative, immediate assessment of holding risks should be conducted, considering reducing positions or exiting to observe.
Like and follow for real-time updates!
$BTC